\n
## Diagram: State Transition and Goal Space Representation
### Overview
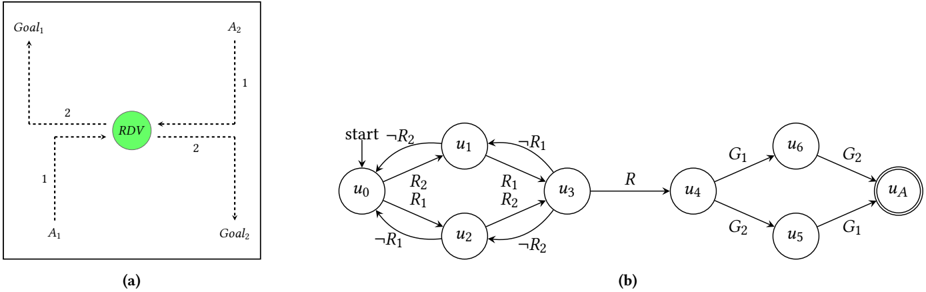
The image presents two diagrams: (a) a 2D goal space with a highlighted region representing a rendezvous (RDV) point, and (b) a state transition diagram illustrating a control process with states, inputs, and a final goal state.
### Components/Axes
**(a) Goal Space:**
* **Axes:**
* Horizontal axis labeled "A₂", ranging from approximately 0 to 4.
* Vertical axis labeled "Goal₂", ranging from approximately 0 to 4.
* **RDV Point:** A green circle labeled "RDV" positioned at approximately (2, 2).
* **Grid:** A dotted grid overlaid on the goal space, with markings at intervals of 1 along both axes.
**(b) State Transition Diagram:**
* **States:** Represented by circles labeled u₀, u₁, u₂, u₃, u₄, u₅, u₆, and uₐ.
* **Transitions:** Represented by directed arrows labeled with inputs (R₁, R₂, -R₁, -R₂) and a final transition labeled "R".
* **Goal States:** States u₆ and u₅ are labeled with "G₁" and u₄ and uₐ are labeled with "G₂".
* **Start State:** State u₀ is labeled "start".
### Detailed Analysis or Content Details
**(a) Goal Space:**
The RDV point is centered within a 4x4 grid. The coordinates of the RDV point are approximately (2, 2). The axes represent the goal space dimensions, A₂ and Goal₂.
**(b) State Transition Diagram:**
* **State u₀ (start):** Has outgoing transitions labeled -R₁, -R₂ to states u₁ and u₂, respectively.
* **State u₁:** Has outgoing transitions labeled R₁ to state u₃ and -R₁ to state u₀.
* **State u₂:** Has outgoing transitions labeled R₂ to state u₃ and -R₂ to state u₀.
* **State u₃:** Has an outgoing transition labeled R to state u₄.
* **State u₄:** Has outgoing transitions labeled G₁ to state u₆ and G₂ to state u₅.
* **State u₅:** Has an outgoing transition labeled G₁ to state u₆.
* **State u₆:** Has an outgoing transition labeled G₂ to state uₐ.
* **State uₐ:** Represents the final goal state.
### Key Observations
* The goal space diagram (a) shows a specific target location (RDV) within a defined area.
* The state transition diagram (b) illustrates a sequence of states and transitions, potentially representing a control system or algorithm.
* The transitions are labeled with inputs (R₁, R₂, -R₁, -R₂) and a final transition (R), suggesting a control mechanism.
* The goal states (G₁, G₂) indicate that the system aims to reach one of these states.
* The diagram shows a path from the start state (u₀) to the final goal state (uₐ) through a series of intermediate states.
### Interpretation
The diagrams likely represent a robotic control problem or a similar system where an agent needs to reach a specific goal (RDV point) in a defined space. The state transition diagram (b) models the agent's behavior, showing how it moves between different states based on inputs (R₁, R₂, -R₁, -R₂). The goal states (G₁, G₂) represent intermediate objectives that the agent must achieve before reaching the final goal (uₐ). The "R" transition could represent a final action or decision that leads to the goal.
The goal space diagram (a) provides the context for the control problem, defining the area where the agent operates and the target location it needs to reach. The state transition diagram (b) provides the logic for how the agent navigates this space. The combination of these diagrams suggests a system designed to achieve a specific goal through a controlled sequence of actions. The use of positive and negative inputs (-R₁, -R₂) suggests a feedback or corrective mechanism.