\n
## Dual Diagram: Spatial Flow and State Transition
### Overview
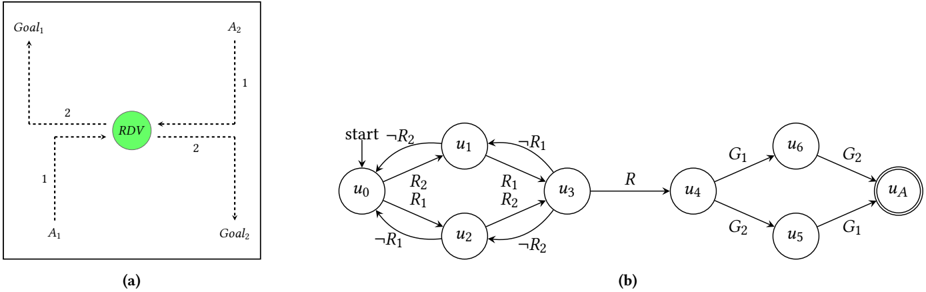
The image contains two distinct technical diagrams labeled (a) and (b). Diagram (a) is a spatial flow or path diagram illustrating movement between points. Diagram (b) is a state transition diagram, specifically a finite automaton or state machine, showing logical progression through states based on conditions.
### Components/Axes
**Diagram (a) - Spatial Flow Diagram:**
* **Nodes/Points:**
* `Goal₁` (Top-left corner)
* `A₁` (Left-center)
* `RDV` (Center, green filled circle)
* `A₂` (Right-center)
* `Goal₂` (Bottom-right corner)
* **Edges/Paths:** Dashed lines with directional arrows and numerical labels (`1`, `2`).
* **Spatial Layout:** The diagram is contained within a rectangular border. The elements are arranged to suggest two symmetric paths converging at a central point (`RDV`) and then diverging to two endpoints.
**Diagram (b) - State Transition Diagram:**
* **States (Circles):** `u₀`, `u₁`, `u₂`, `u₃`, `u₄`, `u₅`, `u₆`, `u_A`.
* `u_A` is a double-circled state, indicating an **accepting** or **final state**.
* **Start Indicator:** An arrow pointing to `u₀` labeled `start`.
* **Transitions (Arrows):** Directed edges between states, each labeled with a condition or symbol.
* **Transition Labels:** `¬R₂`, `R₂`, `R₁`, `¬R₁`, `R`, `G₁`, `G₂`.
### Detailed Analysis
**Diagram (a) - Path Analysis:**
* **Path 1 (from A₁):** A dashed line labeled `1` goes vertically up from `A₁`, then turns right horizontally (labeled `2`) to reach `RDV`. From `RDV`, a dashed line labeled `2` goes right horizontally, then turns down vertically (labeled `1`) to reach `Goal₂`.
* **Path 2 (from A₂):** A dashed line labeled `1` goes vertically down from `A₂`, then turns left horizontally (labeled `2`) to reach `RDV`. From `RDV`, a dashed line labeled `2` goes left horizontally, then turns up vertically (labeled `1`) to reach `Goal₁`.
* **Interpretation of Labels:** The numbers `1` and `2` likely denote sequence steps or movement priorities. The symmetry suggests two agents (`A₁` and `A₂`) moving to a rendezvous point (`RDV`) and then proceeding to opposite goals.
**Diagram (b) - State Machine Analysis:**
* **Initial State:** `u₀`.
* **Transitions from `u₀`:**
* To `u₁` on condition `R₂`.
* To `u₂` on condition `R₁`.
* **Transitions from `u₁`:**
* To `u₀` on condition `¬R₂`.
* To `u₃` on condition `R₁`.
* **Transitions from `u₂`:**
* To `u₀` on condition `¬R₁`.
* To `u₃` on condition `R₂`.
* **Transitions from `u₃`:**
* To `u₁` on condition `¬R₁`.
* To `u₂` on condition `¬R₂`.
* To `u₄` on condition `R`.
* **Transitions from `u₄`:**
* To `u₆` on condition `G₁`.
* To `u₅` on condition `G₂`.
* **Transitions to Final State `u_A`:**
* From `u₆` on condition `G₂`.
* From `u₅` on condition `G₁`.
### Key Observations
1. **Symmetry in (a):** The paths from `A₁` and `A₂` to `RDV` and onward to the goals are mirror images, implying a coordinated or reciprocal process.
2. **Central Rendezvous:** The `RDV` node is the only filled and colored element in (a), highlighting its importance as a mandatory meeting or synchronization point.
3. **State Machine Structure in (b):** The machine has a clear progression from an initial state (`u₀`), through a decision loop involving conditions `R₁` and `R₂` (states `u₀`, `u₁`, `u₂`), to a linear progression (`u₃` -> `u₄`) and finally a branching path to the accepting state `u_A`.
4. **Accepting State:** The double circle on `u_A` signifies successful completion of the process modeled by the automaton.
5. **Condition Logic:** The labels use logical negation (`¬`) and seem to represent binary conditions (`R₁`, `R₂`, `G₁`, `G₂`). The transition from `u₃` to `u₄` on `R` may represent a different, possibly overarching, condition.
### Interpretation
These diagrams likely model a **coordinated multi-agent system or a protocol**.
* **Diagram (a)** provides a **physical or logical flow perspective**. It visualizes the movement of two entities (`A₁`, `A₂`) that must first converge at a rendezvous point (`RDV`) before proceeding to their final destinations (`Goal₁`, `Goal₂`). The numbered steps suggest a specific order of operations is required.
* **Diagram (b)** provides the **formal control logic or state-based specification** for such a system. The states `u₀`-`u₃` model the negotiation or synchronization phase, where the system checks for conditions `R₁` and `R₂` (perhaps "ready" signals from agents `A₁` and `A₂`). Once a condition `R` is met (possibly indicating both are ready at `RDV`), the system progresses to states `u₄`-`u₆`, which manage the final goal assignment (`G₁`, `G₂`). Reaching the accepting state `u_A` signifies both agents have successfully reached their goals.
**Connection:** The rendezvous (`RDV`) in (a) corresponds to the critical transition from the looping states (`u₀`, `u₁`, `u₂`) to the linear progression (`u₃` -> `u₄`) in (b), triggered by condition `R`. The final goals in (a) correspond to the conditions `G₁` and `G₂` leading to `u_A` in (b). The diagrams together describe both the *what* (spatial flow) and the *how* (state-based control) of a synchronized process.