## Heatmap: Performance vs. Number of Feedback Repairs and Initial Programs
### Overview
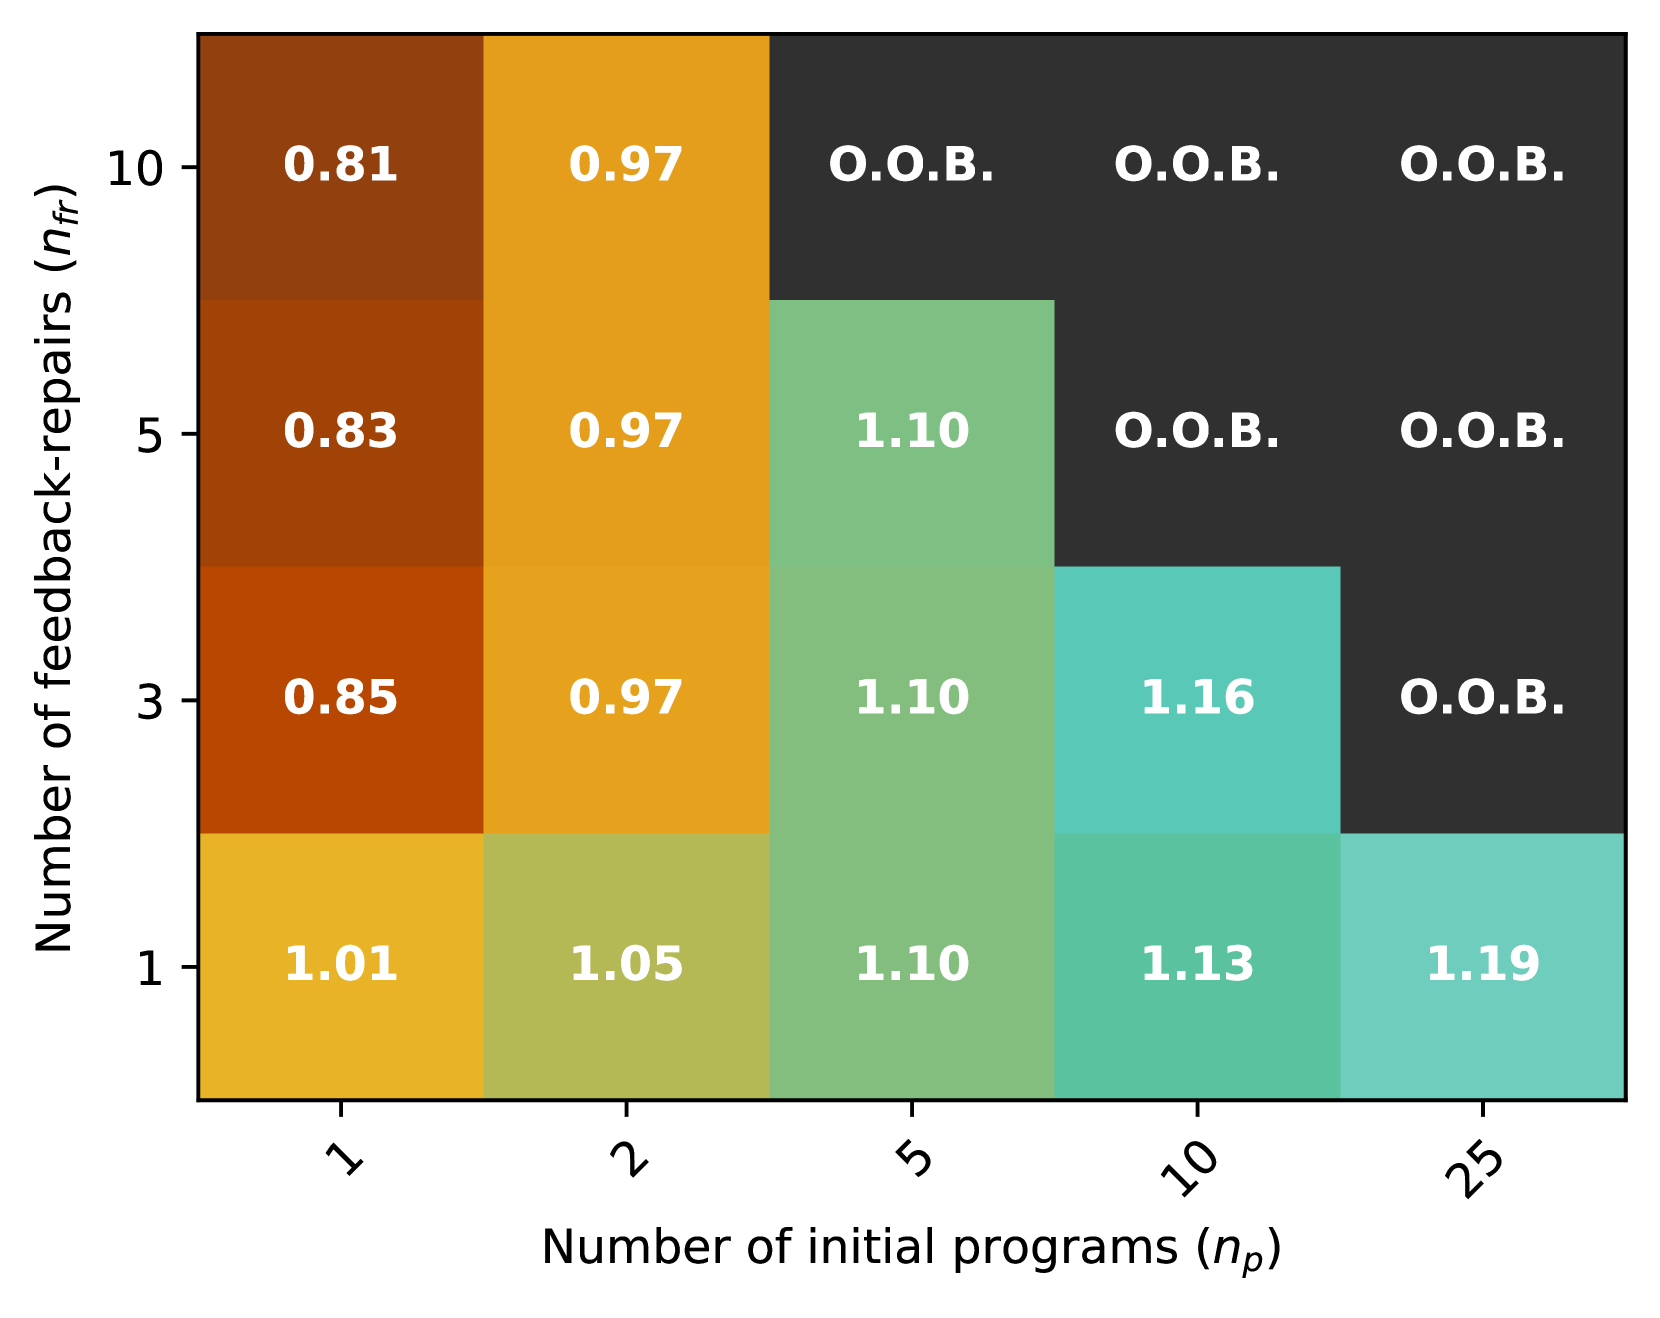
The image is a heatmap visualizing the performance of a system based on two parameters: the number of feedback repairs (nfr) and the number of initial programs (np). The heatmap displays performance values for different combinations of these parameters, with darker colors generally indicating lower performance and lighter colors indicating higher performance. The label "O.O.B." appears to indicate an out-of-bounds condition or a failure state.
### Components/Axes
* **X-axis (Horizontal):** Number of initial programs (np). Values: 1, 2, 5, 10, 25.
* **Y-axis (Vertical):** Number of feedback-repairs (nfr). Values: 1, 3, 5, 10.
* **Color Gradient:** Represents performance values. Darker colors (brown/black) indicate lower values, while lighter colors (yellow/green/cyan) indicate higher values.
* **Data Values:** Numerical values are displayed within each cell of the heatmap, representing the performance for the corresponding combination of nfr and np. The value "O.O.B." is also present.
### Detailed Analysis
The heatmap presents performance values for different combinations of the number of feedback repairs (nfr) and the number of initial programs (np). The values are as follows:
| nfr | np = 1 | np = 2 | np = 5 | np = 10 | np = 25 |
|---|---|---|---|---|---|
| 10 | 0.81 | 0.97 | O.O.B. | O.O.B. | O.O.B. |
| 5 | 0.83 | 0.97 | 1.10 | O.O.B. | O.O.B. |
| 3 | 0.85 | 0.97 | 1.10 | 1.16 | O.O.B. |
| 1 | 1.01 | 1.05 | 1.10 | 1.13 | 1.19 |
* **nfr = 10:**
* np = 1: 0.81 (dark brown)
* np = 2: 0.97 (dark yellow)
* np = 5: O.O.B. (black)
* np = 10: O.O.B. (black)
* np = 25: O.O.B. (black)
* **nfr = 5:**
* np = 1: 0.83 (brown)
* np = 2: 0.97 (dark yellow)
* np = 5: 1.10 (light green)
* np = 10: O.O.B. (black)
* np = 25: O.O.B. (black)
* **nfr = 3:**
* np = 1: 0.85 (brown)
* np = 2: 0.97 (dark yellow)
* np = 5: 1.10 (light green)
* np = 10: 1.16 (cyan)
* np = 25: O.O.B. (black)
* **nfr = 1:**
* np = 1: 1.01 (yellow)
* np = 2: 1.05 (light yellow)
* np = 5: 1.10 (light green)
* np = 10: 1.13 (cyan)
* np = 25: 1.19 (light cyan)
### Key Observations
* Performance generally improves (higher values) as the number of initial programs (np) increases, up to a point.
* For higher numbers of feedback repairs (nfr = 5 and 10), the system results in "O.O.B." for larger numbers of initial programs (np = 5, 10, and 25).
* The best performance (highest values) is observed when the number of feedback repairs is low (nfr = 1) and the number of initial programs is relatively high (np = 25).
* The worst performance (lowest values) is observed when the number of feedback repairs is high (nfr = 10) and the number of initial programs is low (np = 1).
### Interpretation
The heatmap suggests that there is an optimal balance between the number of feedback repairs and the number of initial programs for maximizing system performance. Increasing the number of initial programs generally improves performance, but only up to a certain point. When the number of feedback repairs is too high, the system becomes unstable or encounters an out-of-bounds condition ("O.O.B.") for larger numbers of initial programs. This could indicate that excessive feedback repairs can lead to overfitting or instability, especially when combined with a large number of initial programs. The best performance is achieved with a low number of feedback repairs and a relatively high number of initial programs, suggesting that a more diverse initial population combined with limited feedback is more effective. The "O.O.B." values indicate a failure state, which needs to be investigated to understand the conditions under which the system becomes unstable.