## Heatmap: Feedback-Repairs vs. Initial Programs
### Overview
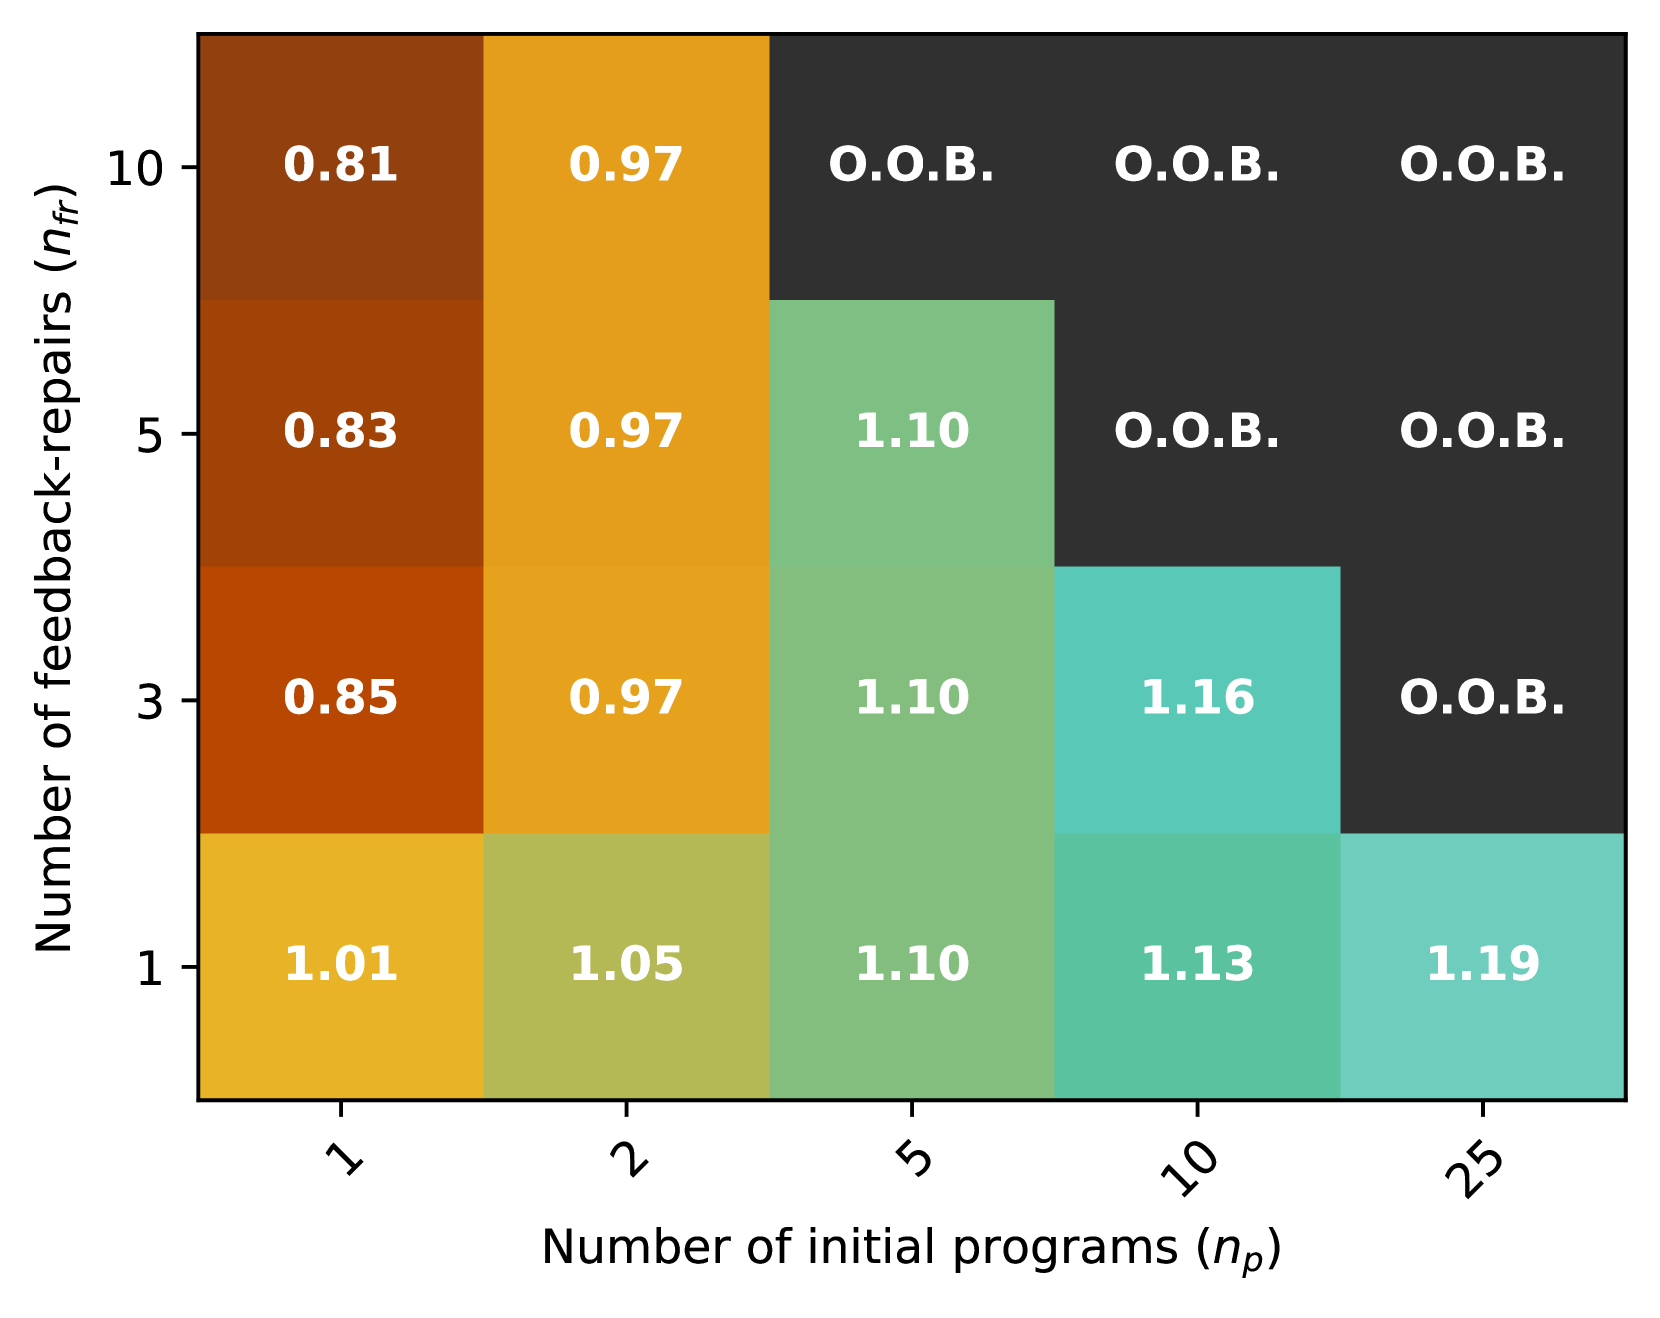
This image presents a heatmap visualizing the relationship between the number of initial programs (n<sub>p</sub>) and the number of feedback-repairs (n<sub>f</sub>). The heatmap uses a color gradient to represent numerical values, with warmer colors (red/orange) indicating lower values and cooler colors (green) indicating higher values. Several cells are marked with "O.O.B." which likely stands for "Out Of Bounds".
### Components/Axes
* **X-axis:** Number of initial programs (n<sub>p</sub>) with markers at 1, 2, 5, 10, and 25.
* **Y-axis:** Number of feedback-repairs (n<sub>f</sub>) with markers at 1, 3, 5, and 10.
* **Color Scale:** Ranges from a dark reddish-brown to a light green, representing the numerical values.
* **Data Labels:** Numerical values are displayed within each cell of the heatmap.
* **"O.O.B." Labels:** Indicates values that are out of bounds or not available.
### Detailed Analysis
The heatmap is a 4x5 grid. Here's a breakdown of the values, row by row:
* **n<sub>f</sub> = 1:**
* n<sub>p</sub> = 1: 1.01
* n<sub>p</sub> = 2: 1.05
* n<sub>p</sub> = 5: 1.10
* n<sub>p</sub> = 10: 1.13
* n<sub>p</sub> = 25: 1.19
* **n<sub>f</sub> = 3:**
* n<sub>p</sub> = 1: 0.85
* n<sub>p</sub> = 2: 0.97
* n<sub>p</sub> = 5: 1.10
* n<sub>p</sub> = 10: 1.16
* n<sub>p</sub> = 25: O.O.B.
* **n<sub>f</sub> = 5:**
* n<sub>p</sub> = 1: 0.83
* n<sub>p</sub> = 2: 0.97
* n<sub>p</sub> = 5: 1.10
* n<sub>p</sub> = 10: O.O.B.
* n<sub>p</sub> = 25: O.O.B.
* **n<sub>f</sub> = 10:**
* n<sub>p</sub> = 1: 0.81
* n<sub>p</sub> = 2: 0.97
* n<sub>p</sub> = 5: O.O.B.
* n<sub>p</sub> = 10: O.O.B.
* n<sub>p</sub> = 25: O.O.B.
**Trends:**
* For a fixed n<sub>f</sub>, the values generally increase as n<sub>p</sub> increases, up to a point.
* As n<sub>f</sub> increases, the values tend to decrease for smaller n<sub>p</sub>, then increase again.
* The upper-right portion of the heatmap is largely filled with "O.O.B." values, suggesting that the model or experiment is not valid or defined for those parameter combinations.
### Key Observations
* The lowest value observed is 0.81 (at n<sub>f</sub> = 10, n<sub>p</sub> = 1).
* The highest value observed is 1.19 (at n<sub>f</sub> = 1, n<sub>p</sub> = 25).
* A significant portion of the data is unavailable ("O.O.B."), particularly for larger values of both n<sub>f</sub> and n<sub>p</sub>.
* The values appear to be clustered around 1.0, with deviations in either direction.
### Interpretation
This heatmap likely represents the results of an experiment or simulation investigating the relationship between the number of initial programs and the number of feedback-repair cycles. The values within the heatmap could represent a metric such as efficiency, accuracy, or performance.
The increasing trend for fixed n<sub>f</sub> as n<sub>p</sub> increases suggests that adding more initial programs can improve performance, but only up to a certain point. The "O.O.B." values indicate that there are limitations to this relationship, and that increasing both n<sub>f</sub> and n<sub>p</sub> beyond certain thresholds leads to undefined or invalid results.
The clustering around 1.0 suggests that the metric is relatively stable, and that the impact of varying n<sub>f</sub> and n<sub>p</sub> is moderate. The deviations from 1.0 could represent the degree of improvement or degradation in performance.
The "O.O.B." values are a critical finding. They suggest that the system being modeled has constraints or limitations that prevent it from functioning effectively under certain conditions. Further investigation is needed to understand the reasons for these limitations and to identify ways to overcome them. The data suggests that the system is sensitive to the interplay between the number of initial programs and the number of feedback-repair cycles.