## Heatmap: Feedback-Repair Ratio vs Initial Programs
### Overview
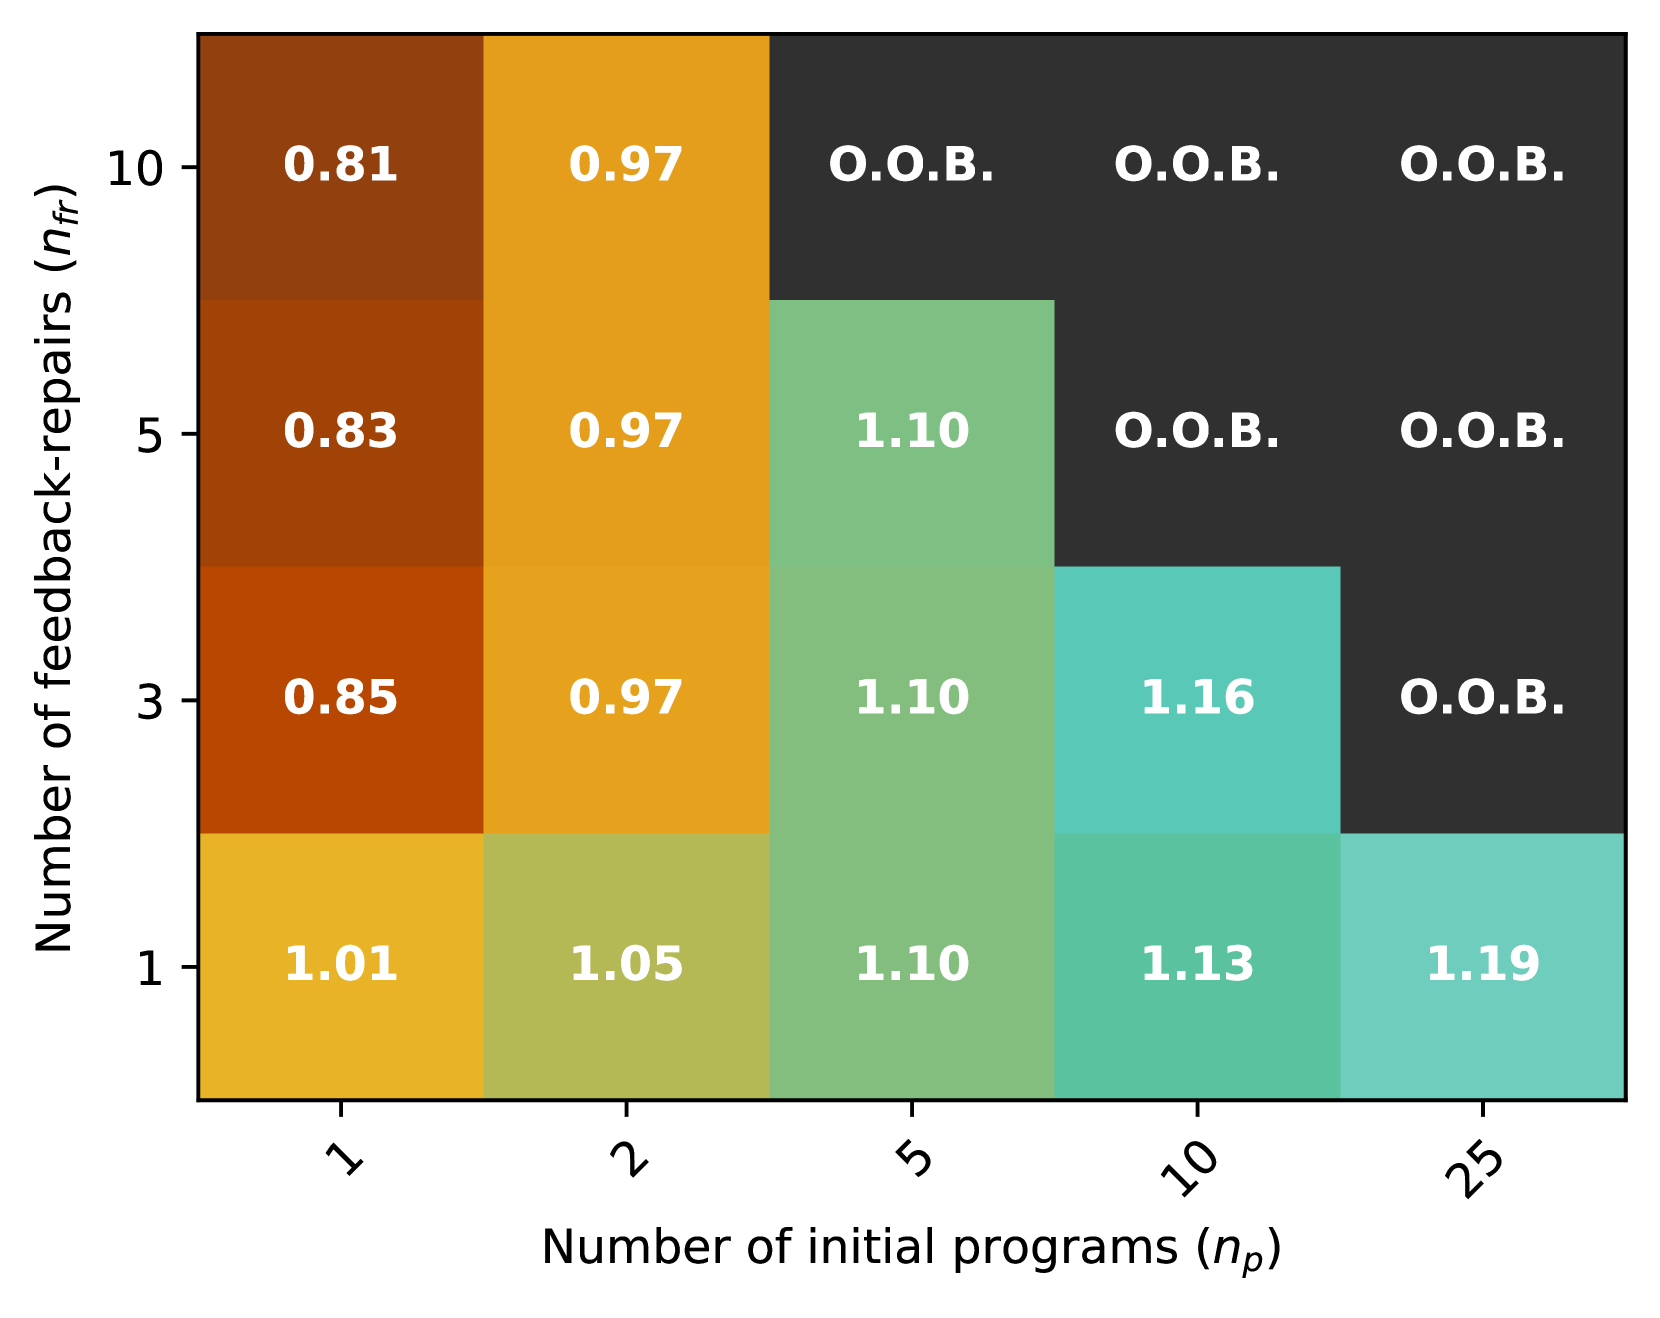
The image is a heatmap visualizing the relationship between the number of initial programs (`n_p`) and the number of feedback-repairs (`n_fr`). Values are represented numerically in cells, with color gradients ranging from dark brown (low values) to black (high values). Some cells contain "O.O.B." (likely indicating "Out of Bounds" or undefined values).
### Components/Axes
- **X-axis (Horizontal)**: "Number of initial programs (`n_p`)" with categories: 1, 2, 5, 10, 25.
- **Y-axis (Vertical)**: "Number of feedback-repairs (`n_fr`)" with categories: 1, 3, 5, 10.
- **Color Gradient**: Dark brown (low values) to black (high values), with no explicit legend but implied by shading.
- **Embedded Text**: Numerical values (e.g., 0.81, 1.19) and "O.O.B." in specific cells.
### Detailed Analysis
- **Data Structure**:
- Rows correspond to `n_fr` (1, 3, 5, 10).
- Columns correspond to `n_p` (1, 2, 5, 10, 25).
- Values increase diagonally from bottom-left (1.01) to top-right (1.19), with "O.O.B." dominating the upper-right quadrant.
- **Key Values**:
- **Low `n_p` (1–2)**: Values range from 0.81 (n_p=1, n_fr=10) to 0.97 (n_p=2, n_fr=1–5).
- **Mid `n_p` (5)**: Values jump to 1.10 (n_fr=3–5) and 1.13 (n_fr=10).
- **High `n_p` (10–25)**: Values reach 1.16 (n_p=10, n_fr=3) and 1.19 (n_p=25, n_fr=1), with "O.O.B." for most combinations.
### Key Observations
1. **Trend**: Feedback-repair ratios generally increase with higher `n_p` and lower `n_fr`.
2. **Anomalies**:
- "O.O.B." appears for `n_p ≥ 5` and `n_fr ≥ 5`, suggesting undefined or non-applicable values beyond these thresholds.
- The highest value (1.19) occurs at `n_p=25` and `n_fr=1`, indicating extreme sensitivity to initial programs when feedback-repairs are minimal.
3. **Color Correlation**: Darker shades (black) align with higher numerical values, confirming the gradient’s consistency.
### Interpretation
The heatmap suggests that increasing the number of initial programs (`n_p`) correlates with higher feedback-repair ratios, particularly when feedback-repairs (`n_fr`) are low. However, beyond `n_p=5` and `n_fr=5`, the system may become unstable or undefined ("O.O.B."), implying a practical limit to scaling. The sharpest increase occurs at `n_p=25` with minimal feedback-repairs, highlighting a potential risk of over-initialization without adequate repair mechanisms. This could inform resource allocation strategies to balance program initialization and repair capacity.