## Heatmap: Few-shot - Core Generalization - o3-mini
### Overview
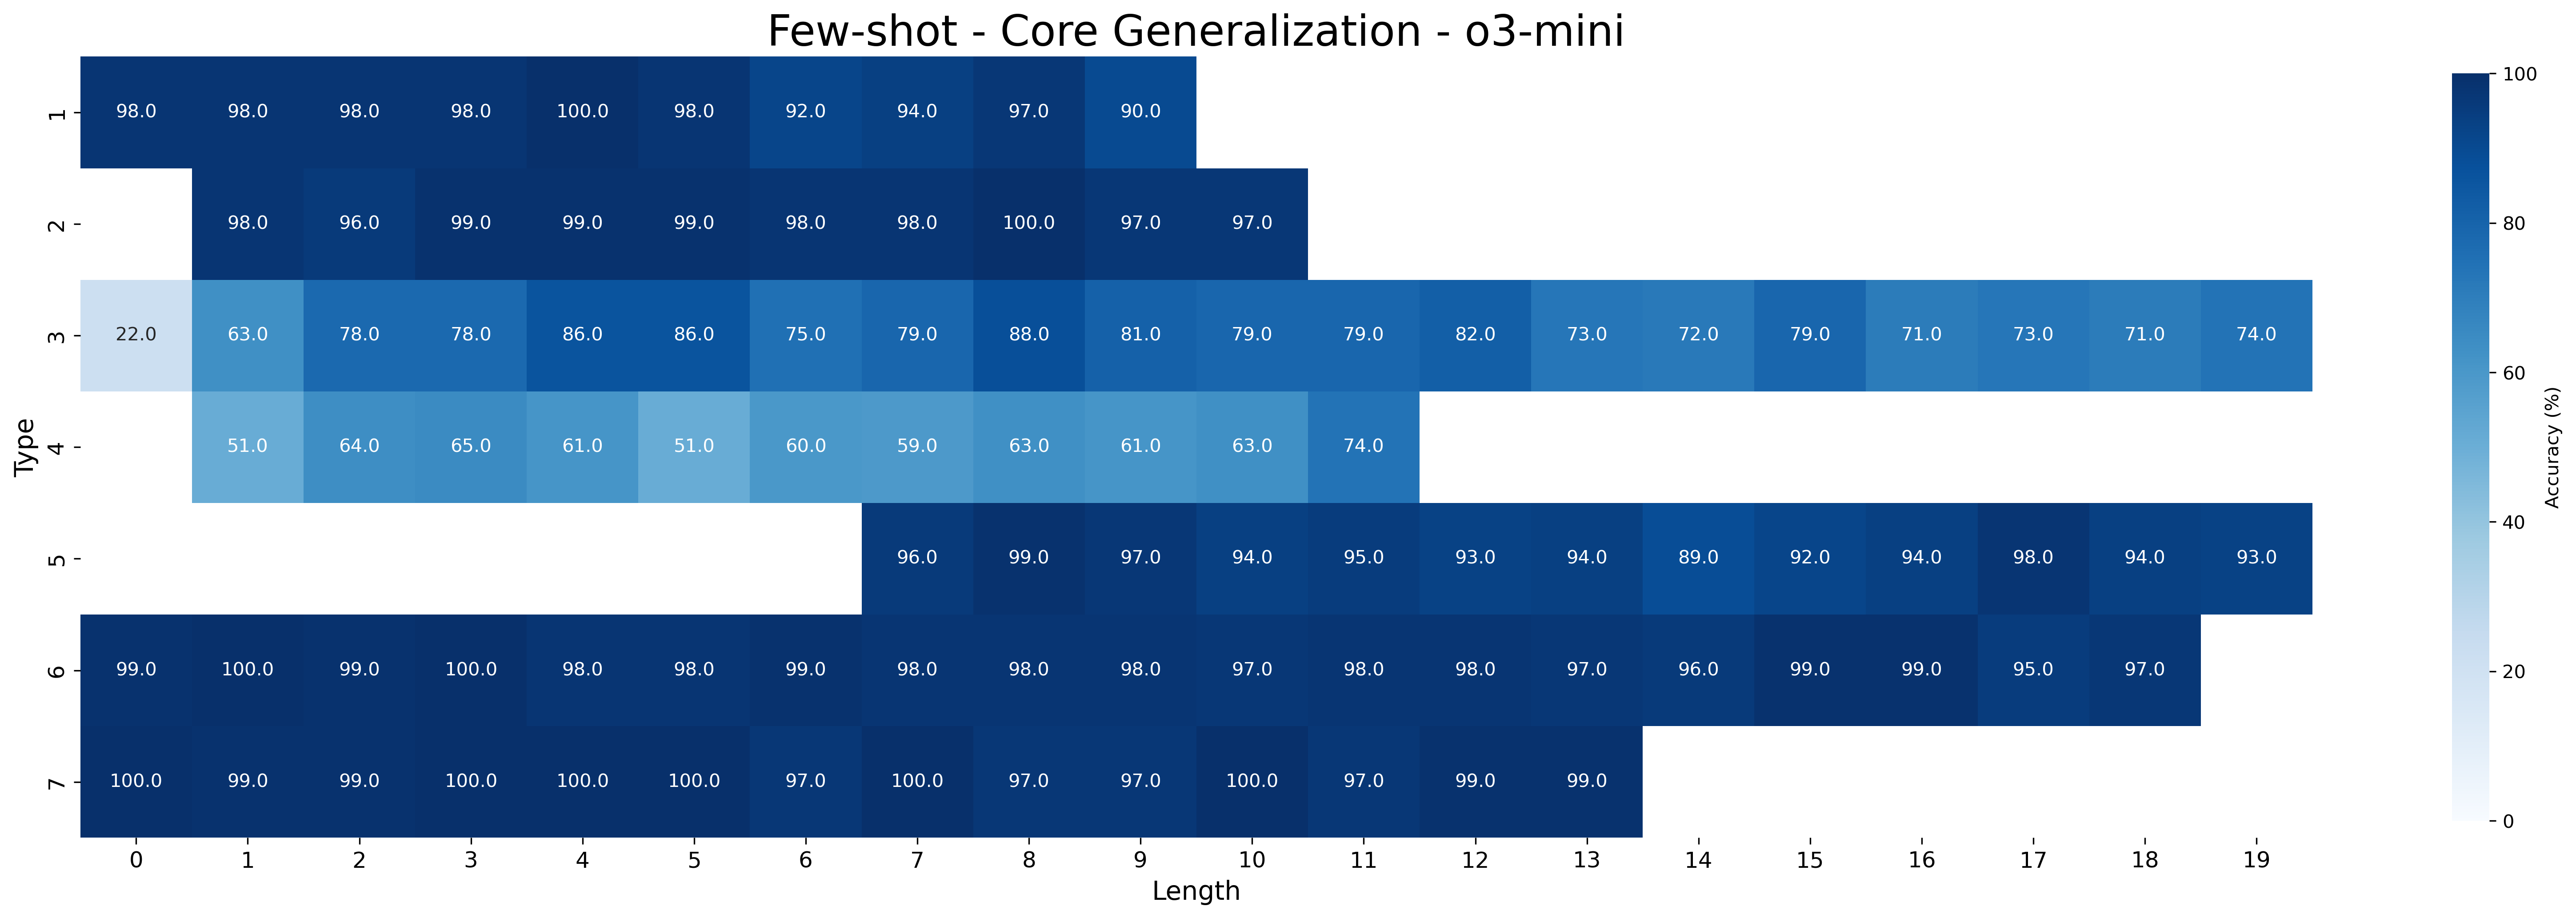
The image is a heatmap visualizing the accuracy of a model across different 'Type' and 'Length' combinations. The color intensity represents the accuracy percentage, ranging from 0% (lightest blue) to 100% (darkest blue).
### Components/Axes
* **Title:** Few-shot - Core Generalization - o3-mini
* **X-axis:** Length, with values ranging from 0 to 19.
* **Y-axis:** Type, with values 1, 2, 3, 4, 5, 6, and 7.
* **Colorbar (Right):** Accuracy (%), ranging from 0 to 100. Darker blue represents higher accuracy.
### Detailed Analysis or ### Content Details
Here's a breakdown of the accuracy values for each Type and Length:
* **Type 1:**
* Length 0: 98.0
* Length 1: 98.0
* Length 2: 98.0
* Length 3: 98.0
* Length 4: 100.0
* Length 5: 98.0
* Length 6: 92.0
* Length 7: 94.0
* Length 8: 97.0
* Length 9: 90.0
* **Type 2:**
* Length 0: 98.0
* Length 1: 96.0
* Length 2: 99.0
* Length 3: 99.0
* Length 4: 99.0
* Length 5: 98.0
* Length 6: 98.0
* Length 7: 100.0
* Length 8: 97.0
* Length 9: 97.0
* **Type 3:**
* Length 0: 22.0
* Length 1: 63.0
* Length 2: 78.0
* Length 3: 78.0
* Length 4: 86.0
* Length 5: 86.0
* Length 6: 75.0
* Length 7: 79.0
* Length 8: 88.0
* Length 9: 81.0
* Length 10: 79.0
* Length 11: 79.0
* Length 12: 82.0
* Length 13: 73.0
* Length 14: 72.0
* Length 15: 79.0
* Length 16: 71.0
* Length 17: 73.0
* Length 18: 71.0
* Length 19: 74.0
* **Type 4:**
* Length 0: 51.0
* Length 1: 64.0
* Length 2: 65.0
* Length 3: 61.0
* Length 4: 51.0
* Length 5: 60.0
* Length 6: 59.0
* Length 7: 63.0
* Length 8: 61.0
* Length 9: 63.0
* Length 10: 74.0
* **Type 5:**
* Length 7: 96.0
* Length 8: 99.0
* Length 9: 97.0
* Length 10: 94.0
* Length 11: 95.0
* Length 12: 93.0
* Length 13: 94.0
* Length 14: 89.0
* Length 15: 92.0
* Length 16: 94.0
* Length 17: 98.0
* Length 18: 94.0
* Length 19: 93.0
* **Type 6:**
* Length 0: 99.0
* Length 1: 100.0
* Length 2: 99.0
* Length 3: 100.0
* Length 4: 98.0
* Length 5: 98.0
* Length 6: 99.0
* Length 7: 98.0
* Length 8: 98.0
* Length 9: 98.0
* Length 10: 97.0
* Length 11: 98.0
* Length 12: 98.0
* Length 13: 97.0
* Length 14: 96.0
* Length 15: 99.0
* Length 16: 99.0
* Length 17: 95.0
* Length 18: 97.0
* **Type 7:**
* Length 0: 100.0
* Length 1: 99.0
* Length 2: 99.0
* Length 3: 100.0
* Length 4: 100.0
* Length 5: 100.0
* Length 6: 97.0
* Length 7: 100.0
* Length 8: 97.0
* Length 9: 97.0
* Length 10: 100.0
* Length 11: 97.0
* Length 12: 99.0
* Length 13: 99.0
### Key Observations
* Types 1, 2, 6, and 7 generally exhibit high accuracy (above 90%) across different lengths.
* Type 3 shows significantly lower accuracy, especially at shorter lengths.
* Type 4 has moderate accuracy, generally between 50% and 75%.
* Type 5 data is only available for lengths 7 and above, with high accuracy.
* There is a trend of increasing accuracy with length for Type 3, although it plateaus.
### Interpretation
The heatmap illustrates the performance of a model under different conditions, likely related to the type of input data and its length. Types 1, 2, 6, and 7 appear to be easier for the model to generalize, consistently achieving high accuracy. Type 3 presents a challenge, indicating that the model struggles with this specific type, especially when the input length is short. Type 4 also poses some difficulty, although not as severe as Type 3. The limited data for Type 5 suggests it performs well for longer lengths. The "o3-mini" in the title might refer to a specific configuration or dataset used in the experiment.