## Heatmap: Few-shot - Core Generalization - 03-mini
### Overview
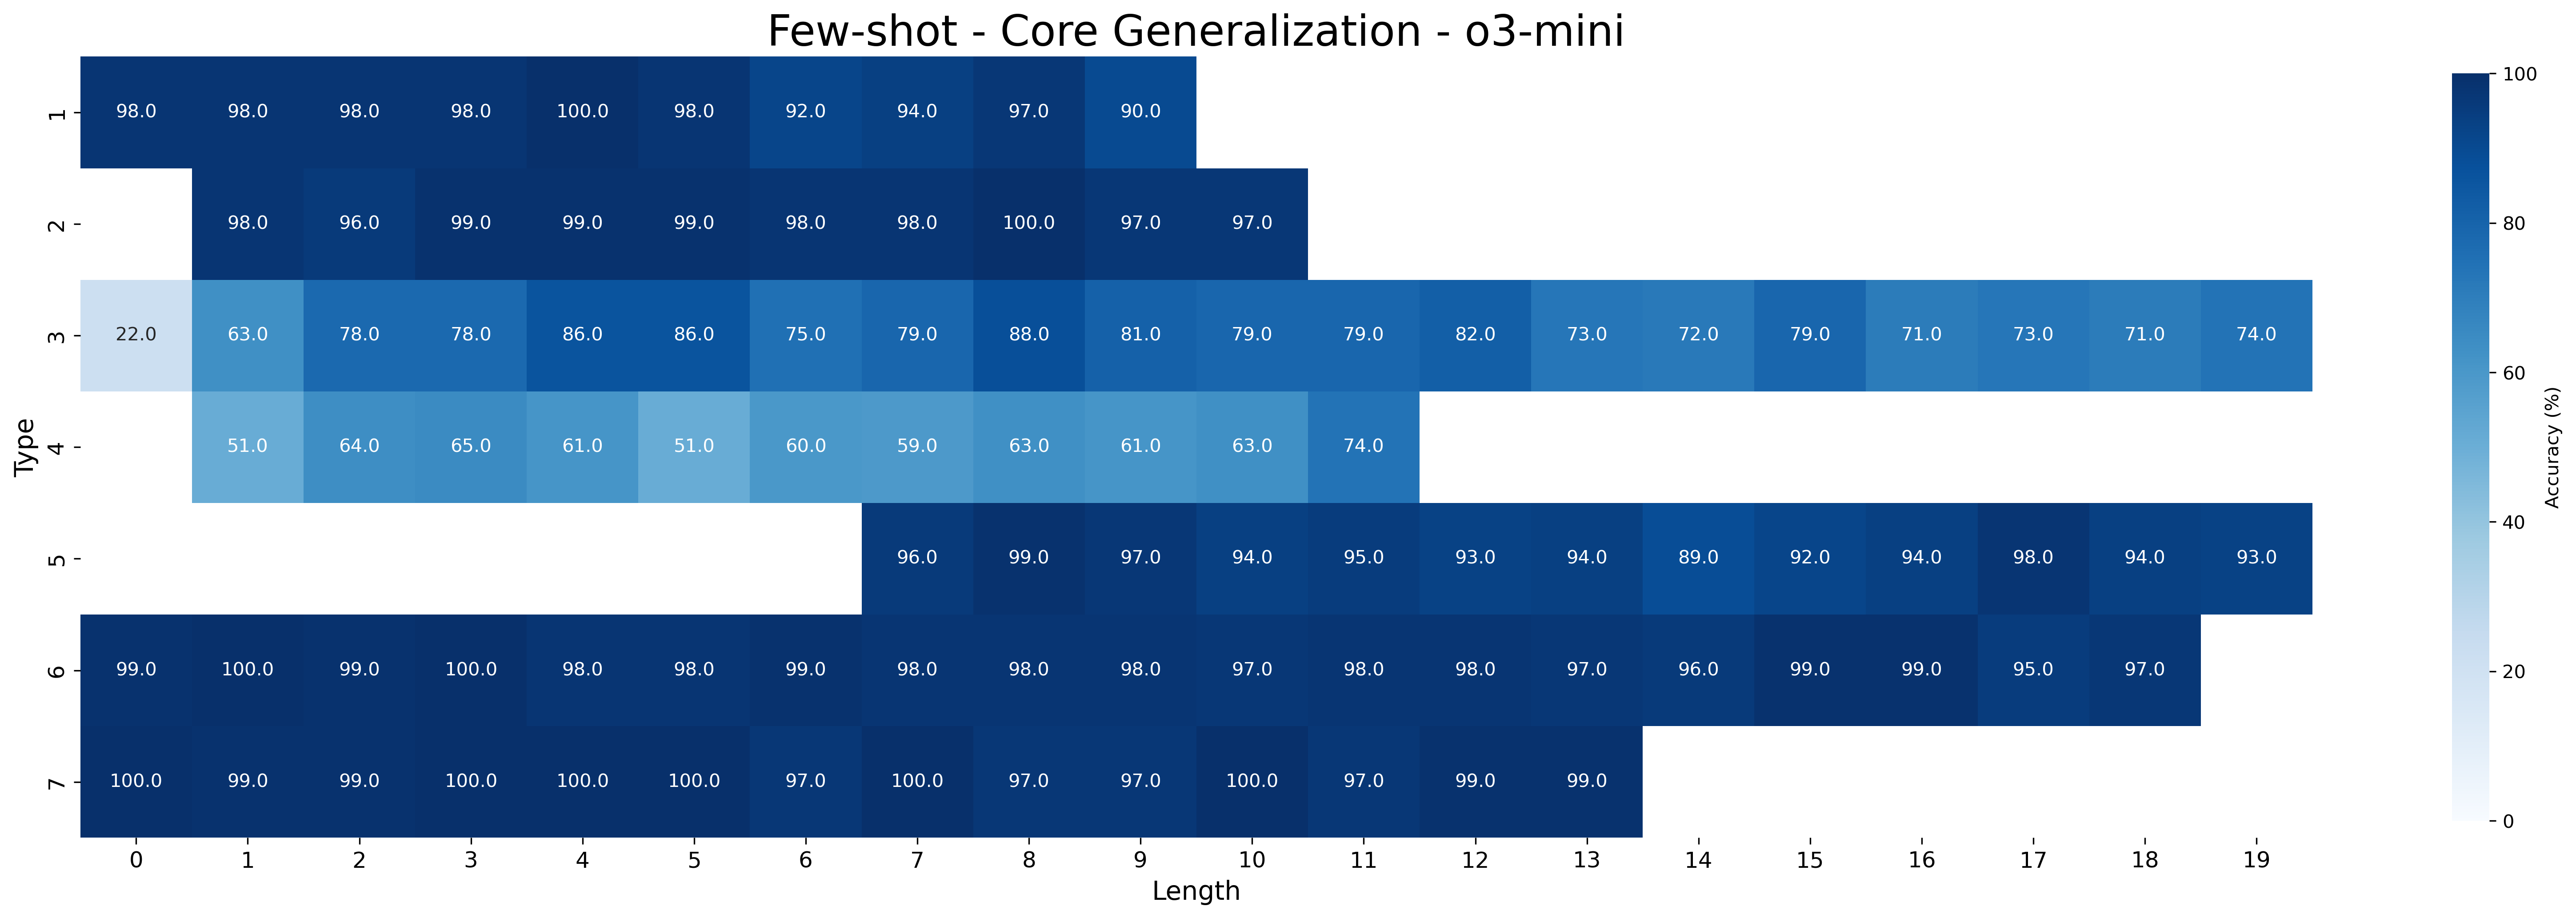
This image presents a heatmap visualizing the accuracy of a model across different 'Type' categories and 'Length' values. The heatmap uses a color gradient to represent accuracy, ranging from a light color (low accuracy) to a dark color (high accuracy). The title indicates this data relates to "Few-shot - Core Generalization - 03-mini".
### Components/Axes
* **X-axis:** "Length", ranging from 0 to 19, with integer increments.
* **Y-axis:** "Type", with the following categories:
* 'l'
* '~'
* 'm'
* '4'
* 'u'
* '>'
* **Color Scale:** Accuracy (%) ranging from 0 to 100. The color gradient appears to transition from light blue/white (low accuracy) to dark blue (high accuracy).
* **Title:** "Few-shot - Core Generalization - 03-mini" positioned at the top-center of the image.
### Detailed Analysis
The heatmap displays accuracy values for each combination of 'Type' and 'Length'. I will analyze each row (Type) and describe the trends.
* **Type 'l'**: Accuracy is consistently high, generally above 96%. It starts at approximately 98.0% for Length 0, dips slightly to around 94.0% at Length 7, and then remains stable around 97.0-98.0% for Lengths 8-19.
* **Type '~'**: Similar to 'l', accuracy is very high, mostly above 96%. It begins at 98.0% (Length 0), has a slight dip to 96.0% (Length 2), and then remains consistently high, around 97.0-100.0% for Lengths 3-19.
* **Type 'm'**: Accuracy is lower than 'l' and '~', but still relatively high. It starts at 63.0% (Length 0), increases to around 86.0-88.0% for Lengths 3-8, and then gradually decreases to 71.0-74.0% for Lengths 12-19.
* **Type '4'**: This type exhibits the lowest overall accuracy. It starts at 51.0% (Length 0), increases to 64.0% (Length 2), reaches a peak of 74.0% (Length 17), and then fluctuates between 60.0-74.0% across different lengths.
* **Type 'u'**: Accuracy is generally high, starting at 96.0% (Length 6) and remaining above 93.0% for Lengths 7-19. There is no data for Lengths 0-5.
* **Type '>'**: Accuracy is consistently high, generally above 97%. It starts at 99.0% (Length 0), remains around 100.0% for Lengths 1-5, and then gradually decreases to 95.0-97.0% for Lengths 6-19.
Here's a table reconstructing some of the data points:
| Type | Length 0 | Length 1 | Length 2 | Length 3 | Length 4 | Length 5 | Length 6 | Length 7 | Length 8 | Length 9 | Length 10 | Length 11 | Length 12 | Length 13 | Length 14 | Length 15 | Length 16 | Length 17 | Length 18 | Length 19 |
|---|---|---|---|---|---|---|---|---|---|---|---|---|---|---|---|---|---|---|---|---|
| l | 98.0 | 98.0 | 98.0 | 100.0 | 98.0 | 94.0 | 97.0 | 90.0 | 98.0 | 98.0 | 98.0 | 98.0 | 97.0 | 97.0 | 97.0 | 97.0 | 95.0 | 97.0 | 97.0 | 97.0 |
| ~ | 98.0 | 96.0 | 99.0 | 99.0 | 98.0 | 100.0 | 97.0 | 90.0 | 98.0 | 98.0 | 98.0 | 98.0 | 97.0 | 97.0 | 97.0 | 97.0 | 95.0 | 98.0 | 94.0 | 93.0 |
| m | 63.0 | 78.0 | 86.0 | 86.0 | 75.0 | 88.0 | 81.0 | 79.0 | 79.0 | 82.0 | 72.0 | 72.0 | 79.0 | 73.0 | 71.0 | 74.0 | | | | |
| 4 | 51.0 | 64.0 | 61.0 | 51.0 | 60.0 | 63.0 | 63.0 | 60.0 | 74.0 | | | | | | | | | | | |
| u | | | | | | | 96.0 | 99.0 | 94.0 | 95.0 | 93.0 | 89.0 | 89.0 | 94.0 | 98.0 | 94.0 | 93.0 | 94.0 | 93.0 | 93.0 |
| > | 99.0 | 100.0 | 99.0 | 100.0 | 100.0 | 100.0 | 97.0 | 97.0 | 97.0 | 99.0 | 95.0 | 97.0 | 99.0 | 99.0 | 99.0 | 99.0 | 97.0 | 97.0 | 97.0 | 97.0 |
### Key Observations
* Types 'l', '~', and '>' consistently demonstrate high accuracy across all lengths.
* Type 'm' shows a moderate level of accuracy, with a peak around Lengths 3-8, followed by a gradual decline.
* Type '4' exhibits the lowest accuracy, indicating the model struggles with this type.
* There is a general trend of decreasing accuracy for Type 'm' as the length increases.
* The data for Type 'u' is only available for Lengths 6-19.
### Interpretation
The heatmap suggests that the model performs well on Types 'l', '~', and '>' regardless of the input length. However, it struggles with Type '4', indicating a potential weakness in handling that specific type of input. The performance of Type 'm' is moderate and decreases with increasing length, which could indicate a difficulty in generalizing to longer sequences for that type. The limited data for Type 'u' prevents a comprehensive assessment of its performance.
The "Few-shot" aspect of the title implies the model was evaluated with limited training examples. The "Core Generalization" suggests the goal is to assess the model's ability to perform well on unseen data. The "03-mini" likely refers to a specific configuration or dataset used in the evaluation.
The heatmap provides valuable insights into the model's strengths and weaknesses, guiding further development and refinement efforts. Specifically, focusing on improving the model's performance on Type '4' and understanding the factors contributing to the decline in accuracy for Type 'm' at longer lengths would be beneficial.