# Technical Analysis of "Few-shot - Core Generalization - o3-mini" Heatmap
## 1. Title and Axes
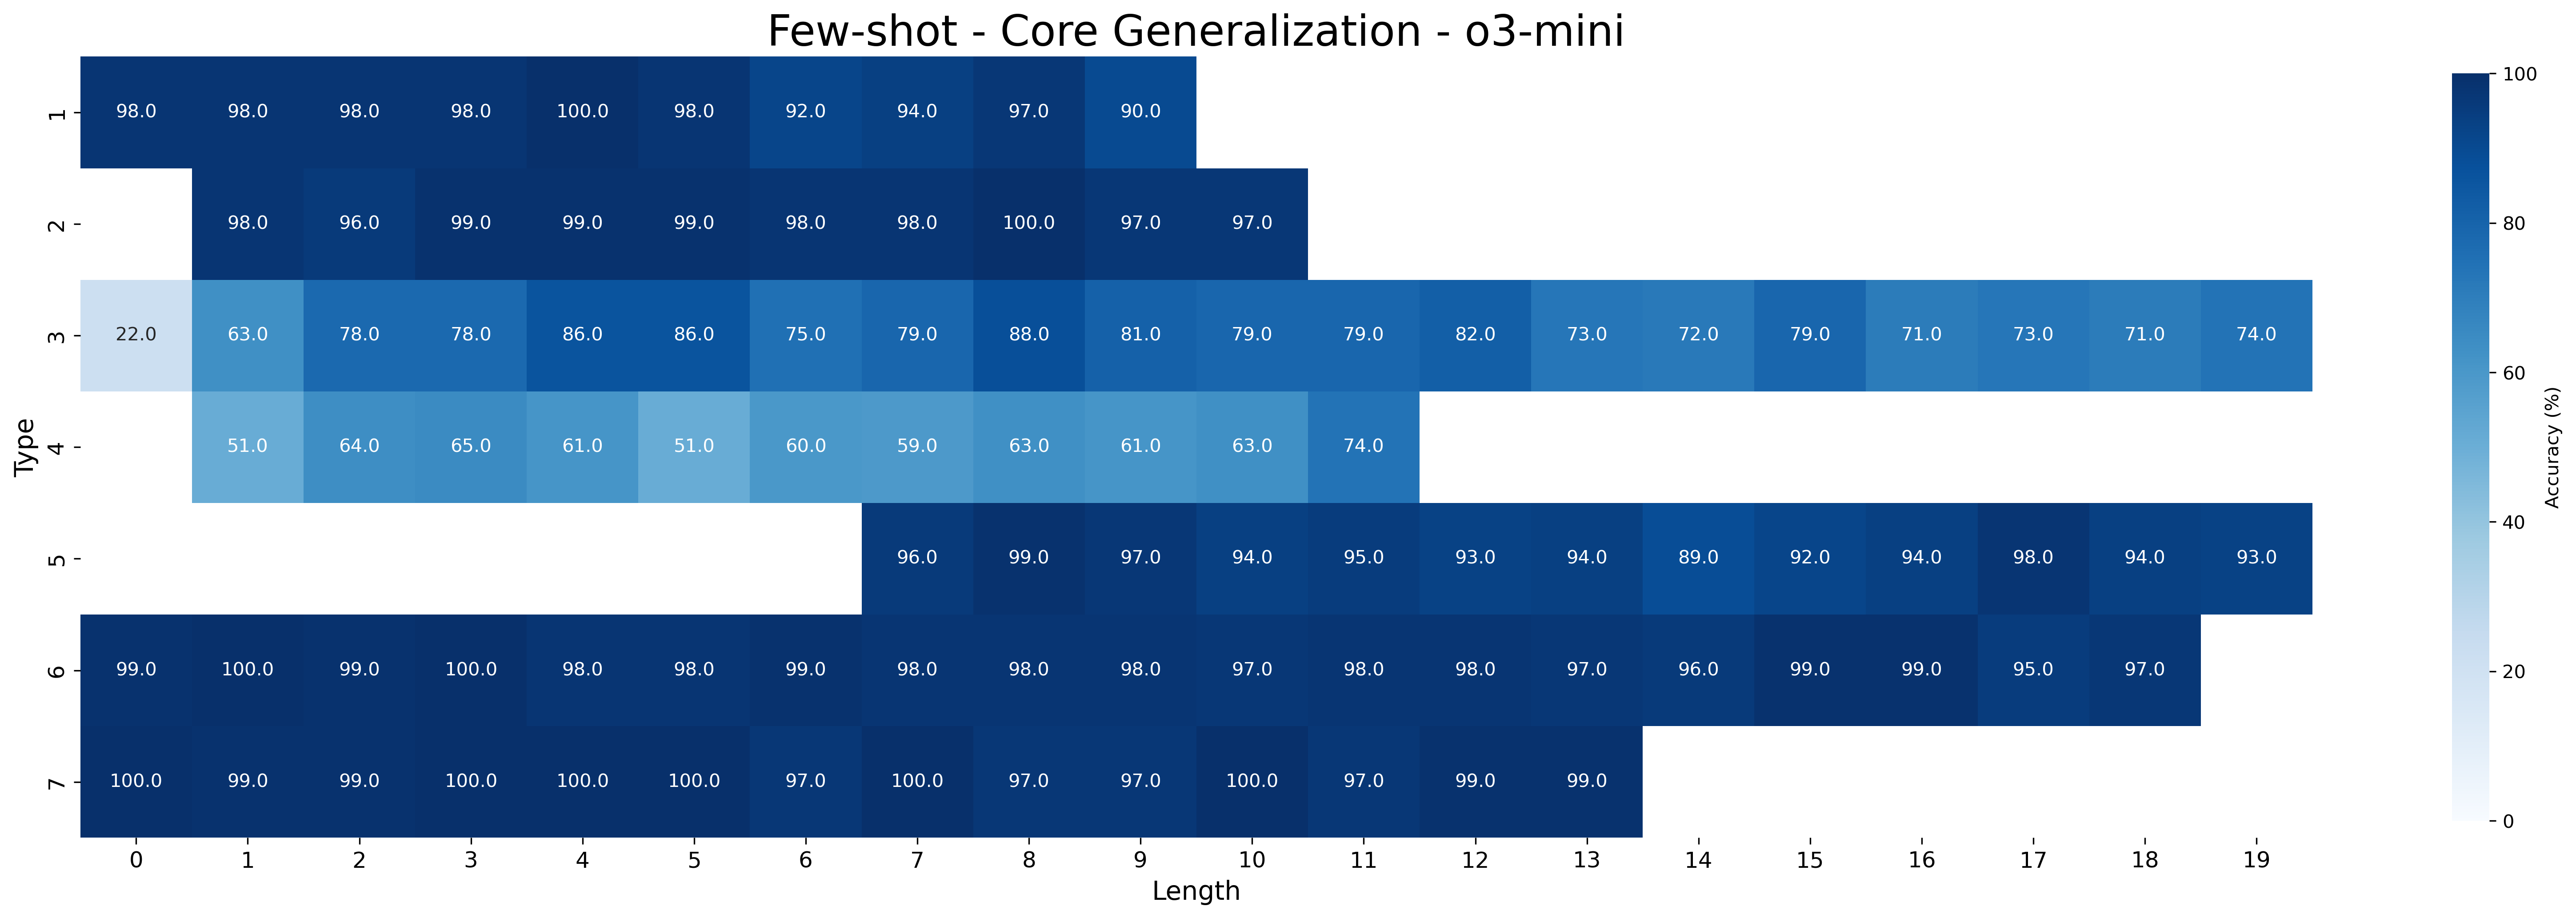
- **Title**: "Few-shot - Core Generalization - o3-mini"
- **X-axis (Horizontal)**:
- Label: "Length"
- Range: 0 to 19 (integer increments)
- **Y-axis (Vertical)**:
- Label: "Type"
- Categories: 1 to 7 (integer increments)
- **Color Bar (Legend)**:
- Label: "Accuracy (%)"
- Scale: 0% (light blue) to 100% (dark blue)
## 2. Data Structure
The heatmap represents accuracy percentages for 7 types (rows) across 20 lengths (columns). Each cell contains a numerical value (e.g., `98.0`, `74.0`).
### Reconstructed Data Table
| Type \ Length | 0 | 1 | 2 | 3 | 4 | 5 | 6 | 7 | 8 | 9 | 10 | 11 | 12 | 13 | 14 | 15 | 16 | 17 | 18 | 19 |
|---------------|------|------|------|------|------|------|------|------|------|------|------|------|------|------|------|------|------|------|------|------|
| **1** | 98.0 | 98.0 | 98.0 | 98.0 | 100.0| 98.0 | 92.0 | 94.0 | 97.0 | 90.0 | | | | | | | | | | |
| **2** | | 98.0 | 96.0 | 99.0 | 99.0 | 99.0 | 98.0 | 98.0 | 100.0| 97.0 | 97.0 | | | | | | | | | |
| **3** | 22.0 | 63.0 | 78.0 | 78.0 | 86.0 | 86.0 | 75.0 | 79.0 | 88.0 | 81.0 | 79.0 | 82.0 | 73.0 | 72.0 | 79.0 | 71.0 | 73.0 | 71.0 | 74.0 | |
| **4** | | 51.0 | 64.0 | 65.0 | 61.0 | 51.0 | 60.0 | 59.0 | 63.0 | 61.0 | 63.0 | 74.0 | | | | | | | | |
| **5** | | | | | | | 96.0 | 99.0 | 97.0 | 94.0 | 95.0 | 93.0 | 94.0 | 89.0 | 92.0 | 94.0 | 98.0 | 94.0 | 93.0 | |
| **6** | 99.0 | 100.0| 99.0 | 100.0| 98.0 | 98.0 | 99.0 | 96.0 | 99.0 | 97.0 | 98.0 | 98.0 | 98.0 | 97.0 | 96.0 | 99.0 | 99.0 | 95.0 | 97.0 | |
| **7** | 100.0| 99.0 | 99.0 | 100.0| 100.0| 100.0| 97.0 | 100.0| 97.0 | 97.0 | 100.0| 97.0 | 99.0 | 99.0 | | | | | | |
## 3. Key Trends
1. **High Accuracy Types (1, 2, 5, 6, 7)**:
- **Type 1**: Consistently high accuracy (90–100%) across all lengths.
- **Type 2**: Near-perfect accuracy (96–100%) with minor dips at Lengths 2–3.
- **Type 5**: High accuracy (93–99%) with a dip at Length 14 (89.0).
- **Type 6**: Near-perfect accuracy (95–100%) with a slight drop at Length 17 (95.0).
- **Type 7**: Dominates with 100% accuracy at Lengths 0, 3, 4, 6, 7, 10, and 11; 97–99% elsewhere.
2. **Low Accuracy Types (3, 4)**:
- **Type 3**: Starts at 22.0 (Length 0) and improves to 88.0 (Length 8), then declines to 71.0 (Length 16).
- **Type 4**: Lowest accuracy (51–74%) across all lengths, peaking at 74.0 (Length 11).
3. **Length-Specific Patterns**:
- **Length 0**: Type 3 (22.0) and Type 4 (51.0) show poor performance.
- **Length 19**: Type 5 (93.0) and Type 7 (99.0) maintain high accuracy.
## 4. Color-Legend Correlation
- **Dark Blue**: Represents 100% accuracy (e.g., Type 7, Length 0).
- **Light Blue**: Represents 0% accuracy (no cells in this range).
- **Intermediate Blues**: Gradual transition from 51% (Type 4, Length 0) to 98% (Type 6, Length 1).
## 5. Spatial Grounding
- **Legend Position**: Right side of the heatmap.
- **Data Point Colors**: Match the legend scale (e.g., 98.0 = dark blue, 74.0 = medium blue).
## 6. Trend Verification
- **Type 1**: Stable high performance (no significant upward/downward trend).
- **Type 3**: Gradual improvement until Length 8, followed by decline.
- **Type 7**: Peaks at 100% for multiple lengths, maintaining >97% accuracy throughout.
## 7. Component Isolation
- **Header**: Title centered at the top.
- **Main Chart**: Heatmap occupying the majority of the image.
- **Footer**: No additional text or components.
## 8. Missing Data
- Cells with empty values (e.g., Type 1, Lengths 10–19) indicate no data for those combinations.
## 9. Language Notes
- All text is in English. No non-English content detected.