## Box Plot: 5-gram Repetition Rate and Lexical Diversity vs. Level (MATH-500)
### Overview
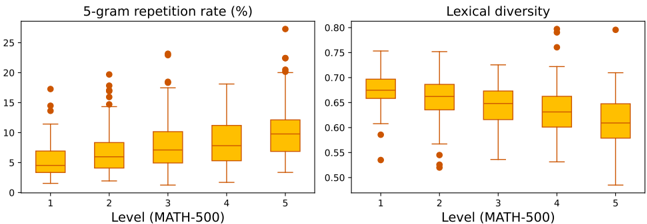
The image presents two box plots side-by-side. The left plot illustrates the 5-gram repetition rate (%) across different levels (1-5) of MATH-500. The right plot shows the lexical diversity across the same levels. Both plots use orange box-and-whisker plots to display the distribution of data for each level.
### Components/Axes
**Left Plot: 5-gram repetition rate (%)**
* **Title:** 5-gram repetition rate (%)
* **Y-axis:** 5-gram repetition rate (%), ranging from 0 to 25. Axis markers are present at 0, 5, 10, 15, 20, and 25.
* **X-axis:** Level (MATH-500), ranging from 1 to 5. Axis markers are present at 1, 2, 3, 4, and 5.
**Right Plot: Lexical diversity**
* **Title:** Lexical diversity
* **Y-axis:** Lexical diversity, ranging from 0.50 to 0.80. Axis markers are present at 0.50, 0.55, 0.60, 0.65, 0.70, 0.75, and 0.80.
* **X-axis:** Level (MATH-500), ranging from 1 to 5. Axis markers are present at 1, 2, 3, 4, and 5.
**Box Plot Elements:**
* Each box plot consists of a box representing the interquartile range (IQR), a line inside the box representing the median, whiskers extending from the box to show the range of the data, and dots representing outliers.
### Detailed Analysis
**Left Plot: 5-gram repetition rate (%)**
* **Level 1:** The box extends from approximately 3% to 7%, with a median around 5%. Several outliers are present between 12% and 18%.
* **Level 2:** The box extends from approximately 4% to 8%, with a median around 6%. Outliers are present between 14% and 20%.
* **Level 3:** The box extends from approximately 5% to 10%, with a median around 7%. Outliers are present between 16% and 24%.
* **Level 4:** The box extends from approximately 7% to 12%, with a median around 9%.
* **Level 5:** The box extends from approximately 7% to 13%, with a median around 10%. Outliers are present between 20% and 27%.
**Trend:** The median and the overall range of the 5-gram repetition rate tend to increase as the level increases from 1 to 5.
**Right Plot: Lexical diversity**
* **Level 1:** The box extends from approximately 0.66 to 0.70, with a median around 0.68. Outliers are present around 0.53 and 0.59.
* **Level 2:** The box extends from approximately 0.63 to 0.72, with a median around 0.67. Outliers are present around 0.53 and 0.55.
* **Level 3:** The box extends from approximately 0.62 to 0.71, with a median around 0.66.
* **Level 4:** The box extends from approximately 0.60 to 0.70, with a median around 0.65. Outliers are present around 0.52 and 0.78.
* **Level 5:** The box extends from approximately 0.58 to 0.68, with a median around 0.63. Outliers are present around 0.80.
**Trend:** The median and the overall range of the lexical diversity tend to decrease as the level increases from 1 to 5.
### Key Observations
* The 5-gram repetition rate generally increases with the MATH-500 level.
* The lexical diversity generally decreases with the MATH-500 level.
* There are outliers in both plots, indicating some variability in the data.
### Interpretation
The data suggests that as the MATH-500 level increases, the text becomes more repetitive (higher 5-gram repetition rate) and less diverse in terms of vocabulary (lower lexical diversity). This could indicate that higher-level MATH-500 content relies more on specific, repeated phrases or that students tend to use a narrower range of vocabulary when dealing with more complex mathematical concepts. The outliers may represent individual cases where the repetition rate or lexical diversity deviates significantly from the norm for a given level.