## Boxplot Pair: Language Model Metrics vs. Level (MATH-500)
### Overview
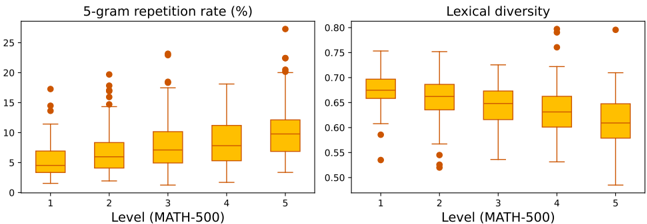
The image presents a pair of boxplots comparing two language model metrics – 5-gram repetition rate (%) and lexical diversity – across five levels of a MATH-500 dataset. Each boxplot displays the distribution of the metric for each level, allowing for a visual comparison of performance.
### Components/Axes
* **X-axis (Both Plots):** Level (MATH-500), ranging from 1 to 5.
* **Y-axis (Left Plot):** 5-gram repetition rate (%), ranging from 0 to 30.
* **Y-axis (Right Plot):** Lexical diversity, ranging from 0.5 to 0.8.
* **Data Points:** Individual orange dots represent data points outside the boxplot whiskers.
* **Boxplots:** Each boxplot represents the distribution of the metric for a specific level. The box represents the interquartile range (IQR), the line inside the box represents the median, and the whiskers extend to the furthest data point within 1.5 times the IQR.
### Detailed Analysis or Content Details
**Left Plot: 5-gram Repetition Rate (%)**
* **Level 1:** Median ≈ 7%, IQR ≈ 5-9%, Minimum ≈ 2%, Maximum ≈ 14%.
* **Level 2:** Median ≈ 8%, IQR ≈ 6-12%, Minimum ≈ 3%, Maximum ≈ 19%.
* **Level 3:** Median ≈ 9%, IQR ≈ 7-13%, Minimum ≈ 4%, Maximum ≈ 18%.
* **Level 4:** Median ≈ 10%, IQR ≈ 8-14%, Minimum ≈ 5%, Maximum ≈ 21%.
* **Level 5:** Median ≈ 11%, IQR ≈ 8-16%, Minimum ≈ 6%, Maximum ≈ 27%.
* **Trend:** The 5-gram repetition rate generally increases with increasing level. The median values consistently rise from Level 1 to Level 5. There are several outliers above the upper whisker, particularly at Levels 4 and 5.
**Right Plot: Lexical Diversity**
* **Level 1:** Median ≈ 0.67, IQR ≈ 0.63-0.71, Minimum ≈ 0.53, Maximum ≈ 0.75.
* **Level 2:** Median ≈ 0.66, IQR ≈ 0.61-0.70, Minimum ≈ 0.54, Maximum ≈ 0.76.
* **Level 3:** Median ≈ 0.65, IQR ≈ 0.61-0.69, Minimum ≈ 0.56, Maximum ≈ 0.76.
* **Level 4:** Median ≈ 0.65, IQR ≈ 0.61-0.69, Minimum ≈ 0.57, Maximum ≈ 0.77.
* **Level 5:** Median ≈ 0.64, IQR ≈ 0.60-0.68, Minimum ≈ 0.55, Maximum ≈ 0.75.
* **Trend:** Lexical diversity generally decreases with increasing level. The median values decline from Level 1 to Level 5. There are some outliers below the lower whisker, particularly at Level 2.
### Key Observations
* The 5-gram repetition rate shows a clear positive correlation with level, indicating that higher levels of the MATH-500 dataset result in more repetitive language generation.
* Lexical diversity exhibits a negative correlation with level, suggesting that language models generate less diverse vocabulary as the level increases.
* The presence of outliers in both plots suggests variability in the data and potential instances of unusual language generation.
### Interpretation
The data suggests a trade-off between repetition and diversity in language model outputs as the complexity of the task (represented by the MATH-500 level) increases. As the level rises, the models tend to rely on more frequent phrases (higher 5-gram repetition rate) and a smaller vocabulary (lower lexical diversity). This could be due to several factors, such as the models struggling to generalize to more complex problems or falling back on simpler, more predictable language patterns. The outliers indicate that some models may perform significantly better or worse than others at specific levels. This could be due to differences in model architecture, training data, or hyperparameter settings. The relationship between these two metrics is important for evaluating the quality of generated text. High repetition can lead to monotonous and unnatural language, while low diversity can limit the expressiveness and creativity of the model.