## Box Plots: 5-gram Repetition Rate and Lexical Diversity Across MATH-500 Levels
### Overview
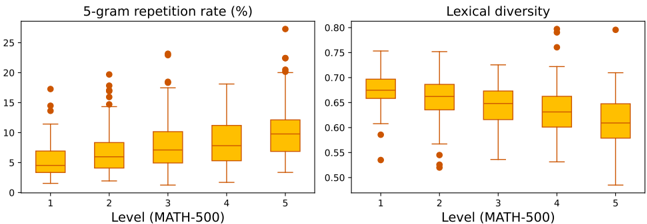
The image contains two side-by-side box plots comparing two metrics across five levels of the MATH-500 dataset. The left plot shows the **5-gram repetition rate (%)**, while the right plot displays **lexical diversity**. Both plots use orange boxes with red outlier markers. Levels 1–5 are labeled on the x-axis, and the y-axes represent percentage values (left) and normalized diversity scores (right).
---
### Components/Axes
- **X-axis (Horizontal)**:
- Label: "Level (MATH-500)"
- Categories: 1, 2, 3, 4, 5 (representing dataset difficulty or complexity levels).
- **Y-axes (Vertical)**:
- Left Plot: "5-gram repetition rate (%)" (range: 0–25%).
- Right Plot: "Lexical diversity" (range: 0.5–0.8, normalized).
- **Legend**:
- No explicit legend is visible. Colors are inferred:
- **Orange**: Box plots (interquartile ranges and medians).
- **Red**: Outlier markers (individual data points outside the whiskers).
---
### Detailed Analysis
#### 5-gram Repetition Rate (%)
- **Level 1**:
- Median: ~5%
- IQR: 3%–7%
- Outliers: 14%, 15%, 17%
- **Level 2**:
- Median: ~7%
- IQR: 5%–9%
- Outliers: 18%, 19%, 20%
- **Level 3**:
- Median: ~9%
- IQR: 7%–11%
- Outliers: 19%, 22%
- **Level 4**:
- Median: ~11%
- IQR: 9%–13%
- Outliers: 23%
- **Level 5**:
- Median: ~13%
- IQR: 11%–15%
- Outliers: 25%
#### Lexical Diversity
- **Level 1**:
- Median: ~0.65
- IQR: 0.6–0.7
- Outliers: 0.55, 0.5
- **Level 2**:
- Median: ~0.68
- IQR: 0.65–0.72
- Outliers: 0.58
- **Level 3**:
- Median: ~0.66
- IQR: 0.62–0.7
- Outliers: 0.75
- **Level 4**:
- Median: ~0.64
- IQR: 0.6–0.68
- Outliers: 0.78
- **Level 5**:
- Median: ~0.6
- IQR: 0.55–0.65
- Outliers: 0.8
---
### Key Observations
1. **5-gram Repetition Rate**:
- Increases monotonically with level (5% → 13%).
- Outliers at higher levels (e.g., 25% at Level 5) suggest occasional extreme repetition.
2. **Lexical Diversity**:
- Slightly decreases with level (0.65 → 0.6).
- Outliers at lower levels (e.g., 0.5 at Level 1) and higher levels (e.g., 0.8 at Level 5) indicate variability.
3. **Trade-off**: Higher repetition correlates with lower lexical diversity, implying a potential inverse relationship between phrase reuse and vocabulary richness.
---
### Interpretation
- **Trend Verification**:
- The left plot’s upward slope (repetition rate) and the right plot’s downward slope (lexical diversity) align with expectations for dataset complexity.
- **Outliers**:
- High repetition outliers (e.g., 25% at Level 5) may reflect overfitting or repetitive problem-solving patterns.
- Low lexical diversity outliers (e.g., 0.5 at Level 1) could indicate simplistic or formulaic responses.
- **Implications**:
- Models trained on higher-level MATH-500 data may prioritize repetition over diversity, risking reduced creativity or generality.
- Lexical diversity outliers suggest some models or responses intentionally vary vocabulary, possibly improving interpretability or adaptability.
---
### Spatial Grounding
- **Left Plot**: Positioned on the left, with y-axis labeled "5-gram repetition rate (%)".
- **Right Plot**: Positioned on the right, with y-axis labeled "Lexical diversity".
- **Outliers**: Red dots are consistently placed above or below the whiskers, visually distinct from the orange boxes.
---
### Content Details
- **No explicit legend**: Colors are inferred from standard box plot conventions (orange for data, red for outliers).
- **No textual annotations**: Values are extracted visually from box plot positions and outlier markers.
- **Uncertainty**: Approximate values are based on visual estimation of box plot quartiles and outlier positions.