## Line Chart: Performance Metrics (Accuracy and Reward) over Training Steps
### Overview
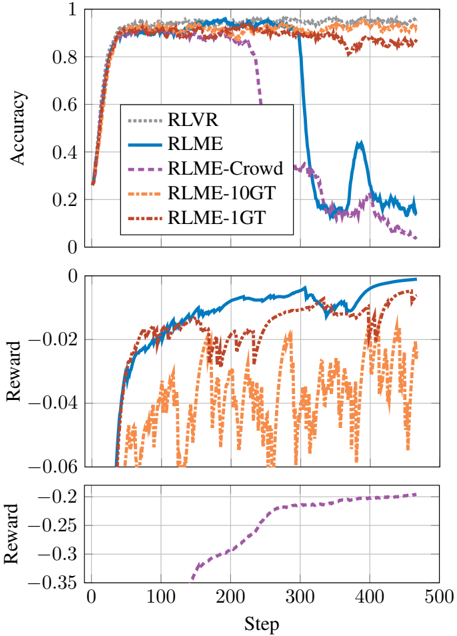
The image presents a composite visualization consisting of three vertically stacked line charts sharing a common x-axis labeled "Step" (ranging from 0 to 500). The charts compare the performance of five different Reinforcement Learning (RL) methods: **RLVR**, **RLME**, **RLME-Crowd**, **RLME-10GT**, and **RLME-1GT**. The top chart tracks "Accuracy," while the middle and bottom charts track "Reward" on different scales.
### Components/Axes
* **X-Axis (Common to all):** "Step", ranging from 0 to 500.
* **Y-Axis (Top Chart):** "Accuracy", ranging from 0 to 1.
* **Y-Axis (Middle Chart):** "Reward", ranging from 0 to -0.06.
* **Y-Axis (Bottom Chart):** "Reward", ranging from -0.35 to -0.20.
* **Legend (Located in the Top Chart, Center-Left):**
* **RLVR:** Grey dotted line.
* **RLME:** Blue solid line.
* **RLME-Crowd:** Purple dashed line.
* **RLME-10GT:** Orange dash-dot line.
* **RLME-1GT:** Dark red dash-dot line.
### Detailed Analysis
#### 1. Top Chart: Accuracy
* **Trend:** All methods begin at an accuracy of approximately 0.25 at Step 0 and rise sharply to approximately 0.9 by Step 50.
* **RLVR (Grey Dotted):** Maintains a stable, high accuracy of ~0.95 throughout the entire duration.
* **RLME-10GT (Orange Dash-Dot):** Maintains a stable, high accuracy of ~0.95 throughout.
* **RLME-1GT (Dark Red Dash-Dot):** Maintains a stable accuracy of ~0.9, with a slight dip toward the end.
* **RLME (Blue Solid):** Maintains ~0.9 accuracy until Step ~300, at which point it crashes sharply to ~0.15. It shows a brief recovery to ~0.4 around Step 380 before dropping back to ~0.15.
* **RLME-Crowd (Purple Dashed):** Maintains ~0.9 accuracy until Step ~250, then drops precipitously, reaching near 0 by Step 450.
#### 2. Middle Chart: Reward (0 to -0.06)
* **RLME (Blue Solid):** Starts at -0.06 and shows a steady, consistent upward trend (becoming less negative), approaching 0 by Step 450.
* **RLME-1GT (Dark Red Dash-Dot):** Starts at -0.06, rises to ~ -0.01 by Step 200, and then fluctuates between -0.01 and -0.02 for the remainder of the steps.
* **RLME-10GT (Orange Dash-Dot):** Starts at -0.06 and exhibits high volatility, fluctuating significantly between -0.06 and -0.02 throughout the training process.
#### 3. Bottom Chart: Reward (-0.35 to -0.20)
* **RLME-Crowd (Purple Dashed):** This is the only series plotted in this chart. It begins appearing at Step ~140 at a value of -0.35. It rises steadily to approximately -0.2 by Step 300 and plateaus near -0.2 for the remainder of the steps.
### Key Observations
* **Performance Divergence:** While RLVR, RLME-10GT, and RLME-1GT maintain high accuracy throughout, RLME and RLME-Crowd suffer from catastrophic performance degradation in the latter half of the training steps.
* **Reward/Accuracy Misalignment:** The RLME (Blue) method is particularly notable. In the top chart, its accuracy crashes after Step 300. However, in the middle chart, its reward continues to climb steadily toward 0. This indicates a potential "reward hacking" scenario, where the agent is successfully maximizing the reward function but failing to perform the actual task (accuracy).
* **Scale Separation:** The RLME-Crowd method is plotted on a separate reward scale (bottom chart), suggesting it operates in a different environment or reward regime compared to the other methods.
### Interpretation
The data demonstrates a comparative study of reinforcement learning agents. The "GT" (likely Ground Truth) variants (10GT and 1GT) and RLVR appear to be the most robust, maintaining high accuracy and stable performance.
The most significant finding is the behavior of the **RLME** agent. The divergence between its accuracy (which collapses) and its reward (which improves) is a classic indicator of **reward misalignment**. The agent has learned to exploit the reward function to achieve high scores without actually solving the underlying task. This suggests that the reward function used for RLME is insufficient or flawed, as it does not correlate with the desired accuracy metric. The RLME-Crowd method also fails in accuracy, though its reward trajectory is distinct, suggesting it may be dealing with a different set of constraints or data quality issues.