\n
## Line Chart: Performance Comparison of RL Algorithms
### Overview
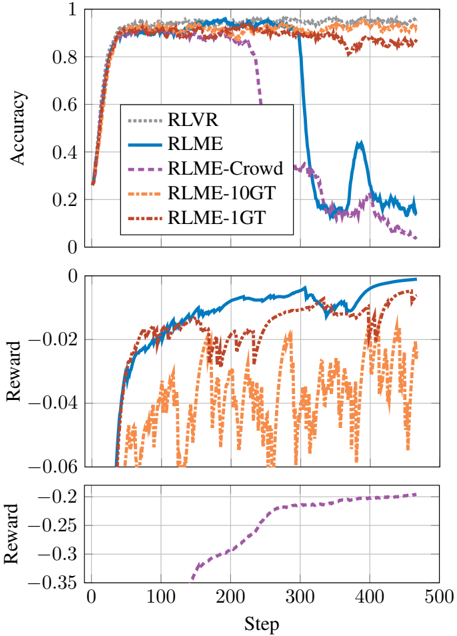
This image presents three line charts stacked vertically, comparing the performance of several Reinforcement Learning (RL) algorithms – RLVR, RLME, RLME-Crowd, RLME-10GT, and RLME-1GT – over 500 steps. The top chart displays accuracy, the middle chart shows reward, and the bottom chart focuses on reward with a different scale.
### Components/Axes
* **X-axis (all charts):** Step (ranging from approximately 0 to 500)
* **Y-axis (Top Chart):** Accuracy (ranging from 0 to 1)
* **Y-axis (Middle Chart):** Reward (ranging from approximately -0.06 to 0)
* **Y-axis (Bottom Chart):** Reward (ranging from approximately -0.35 to -0.2)
* **Legend (Top-Left):**
* RLVR (dotted purple line)
* RLME (solid blue line)
* RLME-Crowd (dashed blue line)
* RLME-10GT (dotted orange line)
* RLME-1GT (dashed orange line)
### Detailed Analysis or Content Details
**Top Chart: Accuracy**
* **RLVR (Purple, dotted):** Starts at approximately 0.75, rises sharply to around 0.9, plateaus around 0.92, then drops dramatically around step 300 to approximately 0.2, and fluctuates between 0.2 and 0.3 for the remainder of the steps.
* **RLME (Blue, solid):** Begins at approximately 0.75, increases steadily to around 0.9, then experiences a significant drop around step 300 to approximately 0.15, followed by oscillations between 0.15 and 0.3.
* **RLME-Crowd (Blue, dashed):** Starts at approximately 0.75, rises to around 0.9, remains relatively stable around 0.9, and then drops to approximately 0.2 around step 300, with some fluctuations.
* **RLME-10GT (Orange, dotted):** Starts at approximately 0.75, increases to around 0.9, and remains relatively stable around 0.9 throughout the 500 steps.
* **RLME-1GT (Orange, dashed):** Starts at approximately 0.75, increases to around 0.9, and remains relatively stable around 0.9 throughout the 500 steps.
**Middle Chart: Reward**
* **RLVR (Purple, dotted):** Starts at approximately -0.04, increases to around -0.01, then fluctuates between -0.02 and -0.05.
* **RLME (Blue, solid):** Starts at approximately -0.04, increases to around -0.01, and remains relatively stable around -0.01 to -0.02.
* **RLME-Crowd (Blue, dashed):** Starts at approximately -0.04, increases to around -0.01, and remains relatively stable around -0.01 to -0.02.
* **RLME-10GT (Orange, dotted):** Starts at approximately -0.05, increases to around -0.02, and fluctuates between -0.03 and -0.05.
* **RLME-1GT (Orange, dashed):** Starts at approximately -0.05, increases to around -0.02, and fluctuates between -0.03 and -0.05.
**Bottom Chart: Reward**
* **RLVR (Purple, dotted):** Starts at approximately -0.28, and decreases steadily to around -0.32 by step 500.
### Key Observations
* All algorithms initially demonstrate similar performance in terms of accuracy, reaching around 0.9.
* Around step 300, RLVR and RLME experience a significant drop in accuracy, while RLME-Crowd, RLME-10GT, and RLME-1GT maintain relatively stable accuracy.
* The reward values are generally small and negative for all algorithms.
* RLVR exhibits a consistent decrease in reward over time, as shown in the bottom chart.
### Interpretation
The data suggests that RLVR and RLME are more susceptible to performance degradation after a certain number of steps (around 300) compared to RLME-Crowd, RLME-10GT, and RLME-1GT. This could indicate that these algorithms are less robust or require more frequent updates or adjustments. The consistent decrease in reward for RLVR suggests that it may be struggling to learn or adapt to the environment over time. The relatively stable performance of RLME-10GT and RLME-1GT might indicate that the use of 10GT and 1GT data improves the algorithm's stability and generalization ability. The different scales on the reward charts suggest that the reward function may be sensitive to the specific algorithm being used. The sudden drop in accuracy around step 300 for RLVR and RLME could be due to a change in the environment or a shift in the task requirements. Further investigation is needed to understand the underlying causes of these performance differences.