\n
## Multi-Panel Line Chart: Performance Metrics of Reinforcement Learning Methods
### Overview
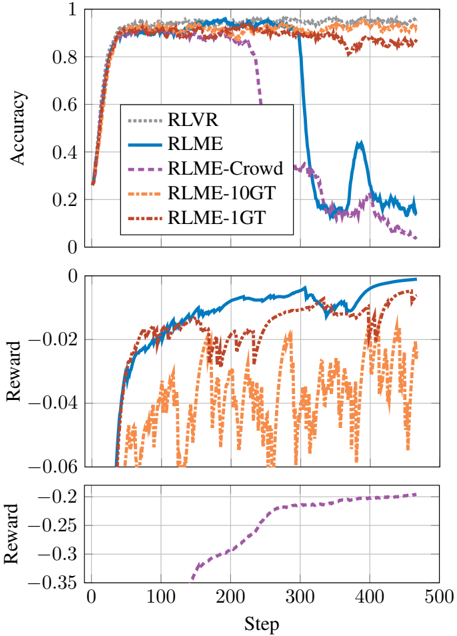
The image displays three vertically stacked line charts sharing a common x-axis labeled "Step". The charts compare the performance of five different reinforcement learning methods or variants over 500 training steps. The top chart measures "Accuracy", while the middle and bottom charts measure "Reward" on two different scales. A single legend in the top chart defines the line styles and colors for all five methods.
### Components/Axes
* **Shared X-Axis:** Labeled "Step" at the bottom of the figure. Major tick marks are at 0, 100, 200, 300, 400, and 500.
* **Top Chart Y-Axis:** Labeled "Accuracy". Scale ranges from 0 to 1 with major ticks at 0, 0.2, 0.4, 0.6, 0.8, and 1.
* **Middle Chart Y-Axis:** Labeled "Reward". Scale is negative, ranging from approximately -0.06 to 0 with major ticks at -0.06, -0.04, -0.02, and 0.
* **Bottom Chart Y-Axis:** Labeled "Reward". Scale is negative, ranging from approximately -0.35 to -0.2 with major ticks at -0.35, -0.3, -0.25, and -0.2.
* **Legend:** Positioned in the top-left quadrant of the top chart. It contains five entries:
1. `RLVR`: Gray, dotted line.
2. `RLME`: Blue, solid line.
3. `RLME-Crowd`: Purple, dashed line.
4. `RLME-10GT`: Orange, dash-dot line.
5. `RLME-1GT`: Red, dash-dot-dot line.
### Detailed Analysis
**Top Chart: Accuracy vs. Step**
* **RLVR (Gray Dotted):** Starts near 0.25 at step 0. Rises rapidly to ~0.9 by step 50. Maintains a high, stable accuracy between ~0.9 and 0.95 for the remainder of the steps, ending near 0.95.
* **RLME (Blue Solid):** Follows a nearly identical initial trajectory to RLVR, reaching ~0.9 by step 50. It remains high until approximately step 300, after which it experiences a catastrophic drop, plummeting to ~0.15 by step 350. It shows a brief, partial recovery to ~0.45 around step 400 before falling again to end near 0.15.
* **RLME-Crowd (Purple Dashed):** Also rises quickly to ~0.9 by step 50. It begins a steady decline around step 250, dropping to ~0.6 by step 300, and continues a steep fall to end near 0.05.
* **RLME-10GT (Orange Dash-Dot):** Rises to ~0.9 by step 50 and maintains a very high and stable accuracy, often the highest of all methods, fluctuating between ~0.9 and 0.98 throughout the entire run.
* **RLME-1GT (Red Dash-Dot-Dot):** Rises to ~0.9 by step 50. It exhibits more volatility than RLVR or RLME-10GT, with noticeable dips (e.g., to ~0.8 around step 250), but generally maintains high accuracy, ending near 0.9.
**Middle Chart: Reward vs. Step (Scale: -0.06 to 0)**
* **RLME (Blue Solid):** Shows a clear, steady upward trend. Starts near -0.06 at step 50, crosses -0.04 around step 100, and continues to improve, approaching 0 by step 500.
* **RLME-1GT (Red Dash-Dot-Dot):** Also shows a general upward trend but with significant volatility. It starts near -0.06, fluctuates heavily between -0.06 and -0.02, and ends near -0.01.
* **RLME-10GT (Orange Dash-Dot):** Exhibits extreme volatility. The reward oscillates rapidly and widely between approximately -0.06 and -0.02 throughout the entire period, with no clear upward or downward trend.
* **RLVR (Gray Dotted) and RLME-Crowd (Purple Dashed):** These lines are not visible on this chart, suggesting their reward values fall outside this specific scale.
**Bottom Chart: Reward vs. Step (Scale: -0.35 to -0.2)**
* **RLME-Crowd (Purple Dashed):** This is the only series plotted on this scale. It shows a steady, monotonic increase. It begins at approximately -0.35 around step 150, rises to -0.25 by step 250, and continues to improve, ending near -0.2 by step 500.
* **All Other Methods:** Not present on this chart, indicating their reward values are higher (less negative) than -0.2.
### Key Observations
1. **Accuracy Collapse:** Two methods, RLME and RLME-Crowd, suffer a severe and late-stage collapse in accuracy after step 300, while the other three methods maintain high accuracy.
2. **Reward Discrepancy:** There is a clear separation in reward scales. RLME-Crowd operates in a much lower reward regime (-0.35 to -0.2) compared to RLME, RLME-1GT, and RLME-10GT (-0.06 to 0).
3. **Stability vs. Volatility:** RLVR and RLME-10GT show the most stable high accuracy. In terms of reward, RLME shows the smoothest improvement, while RLME-10GT is highly unstable.
4. **Method Performance:** RLME-10GT appears to be the top performer for accuracy. RLME shows the best and most consistent reward improvement among the methods plotted on the middle chart's scale.
### Interpretation
This visualization compares different approaches to a reinforcement learning task, likely involving some form of ground truth (GT) or crowd-sourced feedback. The data suggests a critical trade-off:
* **Stability and High Accuracy:** Methods incorporating more ground truth signals (RLME-10GT) or a baseline (RLVR) achieve stable, high accuracy. RLME-10GT's volatile reward, however, indicates that while it classifies correctly, its internal value estimates are noisy.
* **Catastrophic Forgetting:** The RLME and RLME-Crowd methods demonstrate a phenomenon akin to catastrophic forgetting, where performance degrades severely after prolonged training. This is more pronounced in accuracy than in reward for RLME.
* **Regime Separation:** The separate reward scale for RLME-Crowd implies it is solving a different or more difficult version of the problem, or its reward function is defined differently. Its steady improvement in this low-reward regime suggests it is learning, but from a much worse starting point.
* **The Role of Ground Truth:** The stark contrast between RLME-10GT (stable) and RLME (unstable) highlights the importance of the "10GT" component—likely 10 ground truth samples—in preventing performance collapse. RLME-1GT, with only one ground truth sample, shows intermediate stability.
In essence, the charts reveal that while multiple methods can achieve high initial accuracy, their long-term stability and the quality of their learned value functions (reward) vary dramatically, with access to ground truth data being a key differentiating factor.