## Line Chart: Algorithm Performance Comparison (Accuracy & Reward)
### Overview
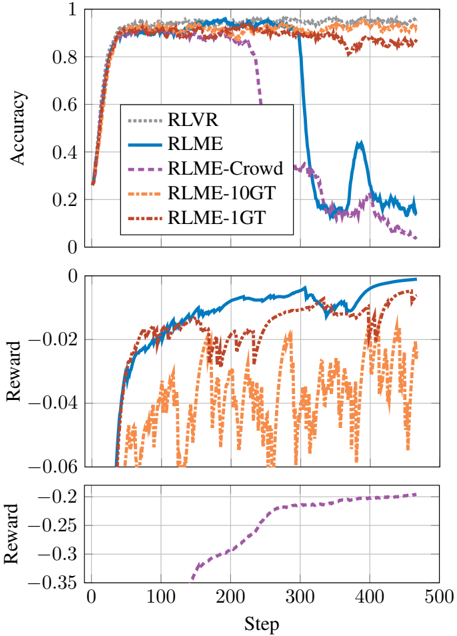
The image contains two stacked line charts comparing the performance of five reinforcement learning algorithms across 500 training steps. The top subplot shows accuracy metrics, while the bottom subplot displays reward values. All lines originate from the bottom-left corner and evolve toward the top-right, with distinct patterns indicating algorithmic behavior.
### Components/Axes
- **X-axis (Steps)**: 0 to 500 (linear scale)
- **Y-axis (Top Subplot - Accuracy)**: 0 to 1 (linear scale)
- **Y-axis (Bottom Subplot - Reward)**: -0.35 to 0 (linear scale)
- **Legend**: Located in the top-right corner of the top subplot, with five entries:
- Gray dashed line: RLVR
- Solid blue line: RLME
- Dashed purple line: RLME-Crowd
- Dashed orange line: RLME-10GT
- Dashed red line: RLME-1GT
### Detailed Analysis
#### Top Subplot (Accuracy)
1. **RLVR (Gray)**: Maintains near-perfect accuracy (~0.95) throughout, with minimal fluctuation.
2. **RLME (Blue)**: Starts at ~0.95, experiences a sharp drop to ~0.3 at step 200, then recovers to ~0.85 by step 500.
3. **RLME-Crowd (Purple)**: Begins at ~0.95, drops to ~0.5 at step 100, and stabilizes at ~0.65 by step 500.
4. **RLME-10GT (Orange)**: Fluctuates between ~0.85 and ~0.95, with no significant drops.
5. **RLME-1GT (Red)**: Similar to RLME-10GT, fluctuating between ~0.85 and ~0.95.
#### Bottom Subplot (Reward)
1. **RLVR (Gray)**: Flat line at 0 reward, indicating no penalty or bonus.
2. **RLME (Blue)**: Starts at -0.05, spikes to -0.01 at step 200, then drops to -0.03 by step 500.
3. **RLME-Crowd (Purple)**: Gradually improves from -0.3 to -0.15 over 500 steps.
4. **RLME-10GT (Orange)**: Oscillates between -0.05 and -0.15, with sharp negative spikes.
5. **RLME-1GT (Red)**: Similar to RLME-10GT, with oscillations between -0.05 and -0.15.
### Key Observations
1. **Accuracy Stability**: RLVR dominates with consistent high accuracy, while RLME-Crowd and RLME-1GT variants show significant degradation.
2. **RLME Anomaly**: The blue line (RLME) exhibits a dramatic accuracy drop at step 200, coinciding with a temporary reward spike. This suggests a potential overfitting or reward hacking event.
3. **Reward Correlation**: Algorithms with higher accuracy (RLVR, RLME-10GT) generally have better reward profiles, except for RLME's anomalous spike.
4. **Crowd vs. 1GT**: Both RLME-Crowd and RLME-1GT underperform compared to their base RLME variant, despite similar reward patterns.
### Interpretation
The data reveals critical insights into algorithmic robustness:
- **RLVR's Superiority**: Its unchanging accuracy suggests architectural stability, making it ideal for mission-critical applications.
- **RLME's Fragility**: The step-200 crash indicates sensitivity to training dynamics, possibly due to reward function misalignment. The subsequent recovery implies partial adaptability but at the cost of reliability.
- **Crowd/1GT Tradeoffs**: These variants sacrifice accuracy for potential computational efficiency (fewer parameters in 1GT) or distributed training benefits (Crowd), but both fail to match baseline performance.
- **Reward Function Behavior**: The negative rewards for most algorithms suggest a penalty for suboptimal actions, with RLME's spike possibly reflecting a temporary exploitation of reward hacking before corrective adjustments.
This analysis underscores the importance of algorithmic stability in reinforcement learning systems, particularly when deploying models in dynamic environments.