## Chart: Theorem Proving Performance
### Overview
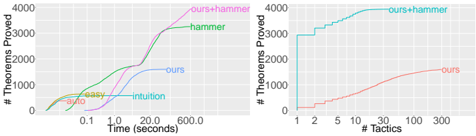
The image contains two line charts comparing the performance of different theorem proving strategies. The left chart plots the number of theorems proved against time (in seconds), while the right chart plots the number of theorems proved against the number of tactics used. Both charts compare "ours" with other strategies like "hammer", "ours+hammer", "auto", "easy", and "intuition".
### Components/Axes
**Left Chart:**
* **X-axis:** Time (seconds), logarithmic scale. Axis markers are at approximately 0.1, 1.0, 20.0, and 600.0.
* **Y-axis:** # Theorems Proved, linear scale. Axis markers are at 0, 1000, 2000, 3000, and 4000.
* **Data Series:**
* **ours+hammer (magenta):** Starts near 0, rises sharply to around 3000 theorems at approximately 20 seconds, then continues to increase to approximately 3800 theorems at 600 seconds.
* **hammer (green):** Starts near 0, rises sharply to around 3000 theorems at approximately 20 seconds, then continues to increase to approximately 3500 theorems at 600 seconds.
* **ours (blue):** Starts near 0, rises gradually to approximately 1500 theorems at 600 seconds.
* **intuition (teal):** Starts near 0, rises to approximately 500 theorems at 1 second, then remains relatively flat.
* **easy (yellow):** Starts near 0, rises to approximately 500 theorems at 0.1 seconds, then remains relatively flat.
* **auto (red):** Starts near 0, rises to approximately 200 theorems at 0.1 seconds, then remains relatively flat.
**Right Chart:**
* **X-axis:** # Tactics, logarithmic scale. Axis markers are at 1, 2, 5, 10, 30, 100, and 300.
* **Y-axis:** # Theorems Proved, linear scale. Axis markers are at 0, 1000, 2000, 3000, and 4000.
* **Data Series:**
* **ours+hammer (teal):** Starts at approximately 200 theorems at 1 tactic, rises sharply to approximately 3200 theorems at 2 tactics, then gradually increases to approximately 3900 theorems at 300 tactics.
* **ours (red):** Starts at approximately 0 theorems at 1 tactic, rises gradually to approximately 1600 theorems at 300 tactics.
### Detailed Analysis
**Left Chart (Time vs. Theorems):**
* **ours+hammer:** The magenta line shows a rapid increase in theorems proved initially, followed by a slower, steady increase.
* **hammer:** The green line follows a similar trend to "ours+hammer" but plateaus slightly earlier and at a lower number of theorems.
* **ours:** The blue line shows a gradual, consistent increase in theorems proved over time, without the initial rapid increase seen in "hammer" and "ours+hammer".
* **intuition, easy, auto:** These lines show a quick initial increase, but then plateau at a low number of theorems.
**Right Chart (Tactics vs. Theorems):**
* **ours+hammer:** The teal line shows a very rapid increase in theorems proved with just a few tactics, then a slower increase as more tactics are used.
* **ours:** The red line shows a gradual, consistent increase in theorems proved as more tactics are used.
### Key Observations
* The "ours+hammer" strategy consistently outperforms "ours" alone in both charts.
* The "hammer" strategy alone performs similarly to "ours+hammer" in the time-based chart, but the "ours+hammer" strategy is better in the tactics-based chart.
* The "intuition", "easy", and "auto" strategies are effective at proving a small number of theorems quickly, but they do not scale well with time.
* The number of theorems proved by "ours+hammer" increases dramatically with the first few tactics.
### Interpretation
The data suggests that combining "ours" with "hammer" significantly improves theorem proving performance compared to using "ours" alone. The "hammer" strategy is also effective, but the combination with "ours" provides a slight advantage. The "intuition", "easy", and "auto" strategies are useful for quickly proving simple theorems, but they are not suitable for more complex problems. The right chart highlights the efficiency of "ours+hammer" in terms of tactics used, suggesting that it can achieve high performance with a relatively small number of tactics. The "ours" strategy, while less effective overall, shows a consistent improvement with more tactics, indicating its potential for further development.