\n
## Charts: Theorem Proving Performance Comparison
### Overview
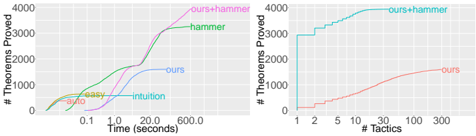
The image presents two charts comparing the performance of different theorem proving systems. The left chart plots the number of theorems proved against time (in seconds), while the right chart plots the number of theorems proved against the number of tactics used. The systems being compared are labeled "ours", "hammer", "ours+hammer", "easy", "auto", and "intuition".
### Components/Axes
**Left Chart:**
* **X-axis:** Time (seconds), scale is logarithmic: 0.1, 1.0, 2.0, 10.0, 20.0, 600.0
* **Y-axis:** # Theorems Proved, scale is linear: 0, 1000, 2000, 3000, 4000
* **Data Series:**
* "ours" (blue)
* "hammer" (green)
* "ours+hammer" (magenta)
* "easy" (yellow)
* "auto" (orange)
* "intuition" (purple)
**Right Chart:**
* **X-axis:** # Tactics, scale is logarithmic: 1, 2, 5, 10, 30, 100, 300
* **Y-axis:** # Theorems Proved, scale is linear: 0, 1000, 2000, 3000, 4000
* **Data Series:**
* "ours" (salmon/reddish-orange)
* "ours+hammer" (cyan/light blue)
### Detailed Analysis or Content Details
**Left Chart:**
* **"ours+hammer" (magenta):** Starts at approximately 0 theorems at 0.1 seconds, rapidly increases to around 3500 theorems by 600 seconds. The curve is steep initially, then plateaus.
* **"hammer" (green):** Starts at approximately 0 theorems at 0.1 seconds, increases more gradually than "ours+hammer", reaching around 2500 theorems at 600 seconds.
* **"ours" (blue):** Starts at approximately 0 theorems at 0.1 seconds, increases at a moderate rate, reaching around 1500 theorems at 600 seconds.
* **"easy" (yellow):** Starts at approximately 0 theorems at 0.1 seconds, increases slowly, reaching around 500 theorems at 600 seconds.
* **"auto" (orange):** Starts at approximately 0 theorems at 0.1 seconds, increases very slowly, reaching around 200 theorems at 600 seconds.
* **"intuition" (purple):** Starts at approximately 0 theorems at 0.1 seconds, increases very slowly, reaching around 100 theorems at 600 seconds.
**Right Chart:**
* **"ours+hammer" (cyan):** Starts at approximately 0 theorems at 1 tactic, jumps to around 2000 theorems at 2 tactics, then increases steadily to around 3800 theorems at 300 tactics. The curve is stepped, with plateaus at certain tactic counts.
* **"ours" (salmon):** Starts at approximately 0 theorems at 1 tactic, increases gradually to around 1500 theorems at 300 tactics. The curve is smoother than "ours+hammer".
### Key Observations
* The "ours+hammer" system consistently outperforms all other systems in both charts.
* The left chart shows that "ours+hammer" achieves a significantly higher number of theorems proved within a given time frame compared to other systems.
* The right chart demonstrates that the performance of "ours+hammer" improves with an increasing number of tactics, but the improvement plateaus after a certain point.
* "easy", "auto", and "intuition" perform significantly worse than "ours", "hammer", and "ours+hammer" in the left chart.
* The right chart focuses only on "ours" and "ours+hammer", highlighting the benefit of combining the two systems in terms of the number of theorems proved as the number of tactics increases.
### Interpretation
The data suggests that combining the "ours" and "hammer" theorem proving systems results in a substantial performance improvement over using either system alone. The left chart indicates that this combination is more efficient in terms of time taken to prove theorems, while the right chart shows that it also scales better with an increasing number of tactics. The logarithmic scales on the x-axes suggest that the initial gains in performance are more significant than later gains. The stepped nature of the "ours+hammer" curve in the right chart might indicate that the system benefits from specific tactic thresholds. The poor performance of "easy", "auto", and "intuition" suggests that they are less effective for this particular type of theorem proving task. The data highlights the importance of system integration and the potential benefits of combining different approaches to achieve optimal performance in automated theorem proving.