\n
## Line Charts: Theorem Proving Performance Comparison
### Overview
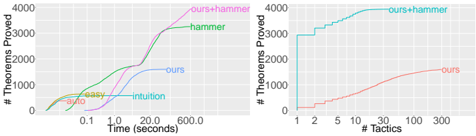
The image contains two side-by-side line charts comparing the performance of four automated theorem proving methods ("ours+hammer", "hammer", "ours", "intuition") across two different metrics: time efficiency and tactic efficiency. Both charts share the same y-axis metric but use different x-axes to evaluate performance from distinct perspectives.
### Components/Axes
**Common Elements:**
* **Y-Axis (Both Charts):** Label: "# Theorems Proved". Scale: Linear, from 0 to 4000, with major gridlines at 1000-unit intervals.
* **Legends:** Positioned in the top-left corner of each chart's plot area.
**Left Chart:**
* **Title/Context:** Performance over time.
* **X-Axis:** Label: "Time (seconds)". Scale: **Logarithmic**. Major tick marks and labels at: 0.1, 1, 10, 20, 60, 600.
* **Legend (4 items):**
* `ours+hammer` (Pink line)
* `hammer` (Green line)
* `ours` (Blue line)
* `intuition` (Orange line)
**Right Chart:**
* **Title/Context:** Performance relative to the number of tactics used.
* **X-Axis:** Label: "# Tactics". Scale: **Logarithmic**. Major tick marks and labels at: 1, 2, 5, 10, 30, 100, 300.
* **Legend (2 items):**
* `ours+hammer` (Cyan line)
* `ours` (Red line)
### Detailed Analysis
**Left Chart (Time vs. Theorems Proved):**
* **Trend Verification:**
* `ours+hammer` (Pink): Steepest initial ascent, maintains lead throughout. Slopes upward sharply before 1 second, continues rising steadily.
* `hammer` (Green): Follows a very similar trajectory to `ours+hammer`, but consistently slightly below it. The gap widens marginally after ~20 seconds.
* `ours` (Blue): Rises more gradually. Shows a noticeable plateau/slowdown between approximately 1 and 10 seconds before resuming a slower climb.
* `intuition` (Orange): Lowest performance curve. Rises slowly and appears to plateau earlier than the others.
* **Approximate Data Points (Key Intersections):**
* At **1 second**: `ours+hammer` & `hammer` ≈ 1200-1500 theorems; `ours` ≈ 500-700; `intuition` ≈ 200-300.
* At **10 seconds**: `ours+hammer` & `hammer` ≈ 2500-2800; `ours` ≈ 1500-1800; `intuition` ≈ 800-1000.
* At **600 seconds (final point)**: `ours+hammer` ≈ 3800; `hammer` ≈ 3600; `ours` ≈ 2000; `intuition` ≈ 900.
**Right Chart (Tactics vs. Theorems Proved):**
* **Trend Verification:**
* `ours+hammer` (Cyan): Extremely steep, near-vertical rise at the very beginning (between 1 and 2 tactics). Reaches a high plateau (≈3500+) very quickly and shows minimal gain after using more than ~10 tactics.
* `ours` (Red): Shows a much more gradual, roughly linear (on this log-linear plot) increase. The number of proved theorems grows steadily as more tactics are employed, without a sharp early plateau.
* **Approximate Data Points:**
* At **2 tactics**: `ours+hammer` ≈ 3000; `ours` ≈ 100-200.
* At **10 tactics**: `ours+hammer` ≈ 3600; `ours` ≈ 500-600.
* At **300 tactics**: `ours+hammer` ≈ 3800 (plateaued); `ours` ≈ 1500.
### Key Observations
1. **Clear Performance Hierarchy:** In the time-based chart, a consistent hierarchy is maintained: `ours+hammer` > `hammer` > `ours` > `intuition`.
2. **Synergy Effect:** The combination `ours+hammer` outperforms its individual components (`ours` and `hammer`), suggesting a synergistic effect where the combined method is more than the sum of its parts.
3. **Efficiency vs. Effort:** The right chart reveals a critical insight: `ours+hammer` is vastly more **efficient**. It solves the vast majority of its theorems with a very small number of tactics (1-10). In contrast, the `ours` method requires a large number of tactics (100+) to approach its maximum yield, indicating a less focused or more exploratory strategy.
4. **Plateau Points:** `intuition` and `ours` (in the time chart) show earlier and lower plateaus, indicating they hit a performance ceiling sooner than the hammer-augmented methods.
### Interpretation
This data strongly suggests that integrating automated "hammer" tools with the authors' method (`ours`) yields significant performance gains in automated theorem proving. The benefit is twofold:
1. **Speed:** The combined method proves more theorems in less time.
2. **Tactic Efficiency:** More importantly, it proves them with far fewer proof attempts (tactics). This implies the combined system is better at selecting the correct, productive proof steps early on, avoiding wasted computation on unproductive paths.
The `hammer` method alone is also highly effective, nearly matching the combined method's time performance. This indicates the hammer component is the primary driver of raw proving power. The value of `ours` appears to be in enhancing the efficiency of the hammer, as seen in the right chart, where `ours+hammer` achieves its results with extreme tactic economy. The `intuition` baseline serves as a reference point, showing the substantial improvement offered by all other, more automated approaches. The charts collectively argue for the efficacy of hybrid systems that combine different automated reasoning strategies.