## Line Graphs: Theorems Proved Over Time and Tactics
### Overview
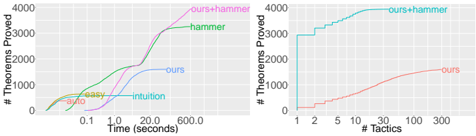
The image contains two line graphs comparing the performance of different theorem-proving methods. The left graph tracks theorems proved over time (seconds), while the right graph tracks theorems proved against the number of tactics used. Multiple data series are represented with distinct colors and labels.
---
### Components/Axes
#### Left Graph (Time vs. Theorems Proved)
- **X-axis**: Time (seconds), ranging from 0 to 600.
- **Y-axis**: Number of Theorems Proved, ranging from 0 to 4000.
- **Legend**: Positioned on the right. Labels and colors:
- `auto` (red)
- `easy` (yellow)
- `intuition` (cyan)
- `hammer` (green)
- `ours` (blue)
- `ours+hammer` (magenta)
#### Right Graph (Tactics vs. Theorems Proved)
- **X-axis**: Number of Tactics, ranging from 1 to 300.
- **Y-axis**: Number of Theorems Proved, ranging from 0 to 4000.
- **Legend**: Positioned on the left. Labels and colors:
- `ours` (red)
- `ours+hammer` (cyan)
---
### Detailed Analysis
#### Left Graph Trends
1. **`auto` (red)**: Starts at ~50 theorems, increases slowly to ~150 by 600 seconds.
2. **`easy` (yellow)**: Starts at ~50 theorems, rises gradually to ~200 by 600 seconds.
3. **`intuition` (cyan)**: Begins at 0, peaks at ~100 theorems around 20 seconds, then plateaus.
4. **`hammer` (green)**: Starts at ~50 theorems, surges to ~3000 by 20 seconds, then stabilizes.
5. **`ours` (blue)**: Starts at ~50 theorems, increases steadily to ~1500 by 600 seconds.
6. **`ours+hammer` (magenta)**: Combines `ours` and `hammer`, starts at ~50 theorems, peaks at ~3500 by 20 seconds, then plateaus.
#### Right Graph Trends
1. **`ours` (red)**: Starts at 0 theorems, increases linearly to ~1500 by 300 tactics.
2. **`ours+hammer` (cyan)**: Jumps to 3000 theorems at 1 tactic, remains flat at 3000 for all subsequent tactics.
---
### Key Observations
1. **Time Efficiency**:
- `ours+hammer` achieves the highest theorem count (~3500) within 20 seconds, outperforming all other methods.
- `hammer` alone reaches ~3000 theorems by 20 seconds but plateaus, while `ours` continues improving over time.
2. **Tactic Efficiency**:
- `ours+hammer` achieves 3000 theorems with just 1 tactic, while `ours` alone requires 300 tactics to reach ~1500 theorems.
- `ours+hammer` maintains maximum efficiency regardless of tactic count, suggesting optimal scalability.
---
### Interpretation
The data demonstrates that combining `ours` and `hammer` methods yields superior performance in both time and tactic efficiency. The `hammer` method provides a significant boost in early stages (left graph) and drastically reduces the number of tactics needed (right graph). This synergy suggests that `hammer` complements `ours` by accelerating initial progress and maintaining high output with minimal resource expenditure. Other methods (`auto`, `easy`, `intuition`) lag behind, indicating they are less effective for large-scale theorem proving. The flat performance of `ours+hammer` in the right graph implies diminishing returns after the initial tactic, highlighting its optimal efficiency.