## Line Graphs: Trade-off between Exploitability and Social Welfare
### Overview
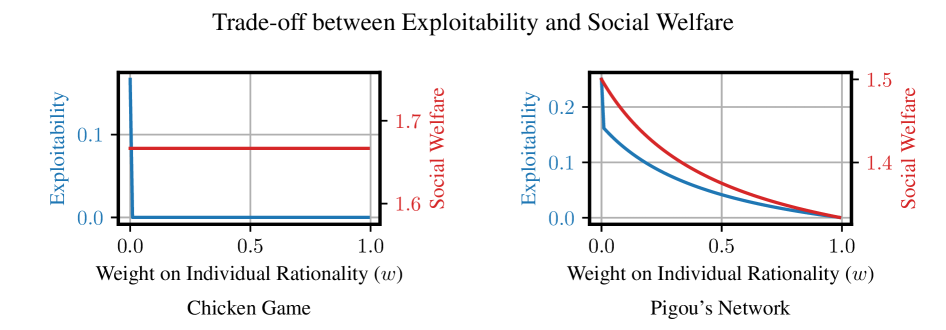
The image contains two line graphs comparing the relationship between **Weight on Individual Rationality (w)** and two metrics: **Exploitability** and **Social Welfare**. The graphs are labeled "Chicken Game" (left) and "Pigou’s Network" (right). Both graphs use a horizontal axis (w) ranging from 0 to 1 and vertical axes for Exploitability and Social Welfare. The graphs illustrate how these metrics trade off as individual rationality increases.
---
### Components/Axes
#### Chicken Game (Left Graph)
- **X-axis**: Weight on Individual Rationality (w) [0.0 to 1.0]
- **Y-axis**:
- Exploitability (blue line)
- Social Welfare (red line)
- **Legend**:
- Red = Social Welfare
- Blue = Exploitability
- **Key Features**:
- Horizontal lines for both metrics (no variation with w).
#### Pigou’s Network (Right Graph)
- **X-axis**: Weight on Individual Rationality (w) [0.0 to 1.0]
- **Y-axis**:
- Exploitability (blue curve)
- Social Welfare (red curve)
- **Legend**:
- Red = Social Welfare
- Blue = Exploitability
- **Key Features**:
- Curves for both metrics (decreasing trend with w).
---
### Detailed Analysis
#### Chicken Game
- **Exploitability (Blue Line)**:
- Constant at approximately **0.1** across all w values.
- **Social Welfare (Red Line)**:
- Constant at approximately **1.7** across all w values.
- **Trend**: No change in either metric as w increases.
#### Pigou’s Network
- **Exploitability (Blue Curve)**:
- Starts at **~0.2** when w = 0.0.
- Decreases to **~0.0** at w = 1.0.
- Slope: Steep decline initially, flattening near w = 1.0.
- **Social Welfare (Red Curve)**:
- Starts at **~1.5** when w = 0.0.
- Decreases to **~1.4** at w = 1.0.
- Slope: Gradual decline, remaining above the blue curve throughout.
- **Trend**: Both metrics decrease as w increases, but Social Welfare remains higher than Exploitability.
---
### Key Observations
1. **Chicken Game**:
- Social Welfare is **~17x higher** than Exploitability (1.7 vs. 0.1).
- Neither metric is affected by changes in individual rationality (w).
2. **Pigou’s Network**:
- Social Welfare and Exploitability both decline as w increases.
- Social Welfare remains **~0.1–0.2 higher** than Exploitability at all w values.
- The trade-off is asymmetric: Exploitability drops sharply, while Social Welfare declines more gradually.
---
### Interpretation
1. **Chicken Game**:
- The absence of variation in Exploitability and Social Welfare suggests that individual rationality (w) has no impact on outcomes in this game. This could imply a static equilibrium where strategic behavior is unaffected by rationality weights.
2. **Pigou’s Network**:
- The downward trends indicate that increasing individual rationality reduces both Exploitability and Social Welfare. However, Social Welfare remains dominant, suggesting that rational actors prioritize collective outcomes over exploitative behavior.
- The steeper decline in Exploitability implies that rational actors actively avoid exploitation, but the gradual drop in Social Welfare may reflect diminishing returns from cooperation or coordination costs.
3. **General Insight**:
- Both graphs highlight a tension between individual rationality and collective welfare. In Pigou’s Network, higher rationality reduces exploitation but also slightly lowers overall welfare, possibly due to over-correction or reduced flexibility in strategic interactions.
---
### Notes on Data Extraction
- All values are approximate, derived from visual inspection of the graphs.
- Legend colors (red = Social Welfare, blue = Exploitability) were cross-verified with line placements in both graphs.
- Spatial grounding: Legends are positioned on the right side of each graph, aligned with their respective y-axes.