## Heatmaps: Similarity Matrices for Network Security
### Overview
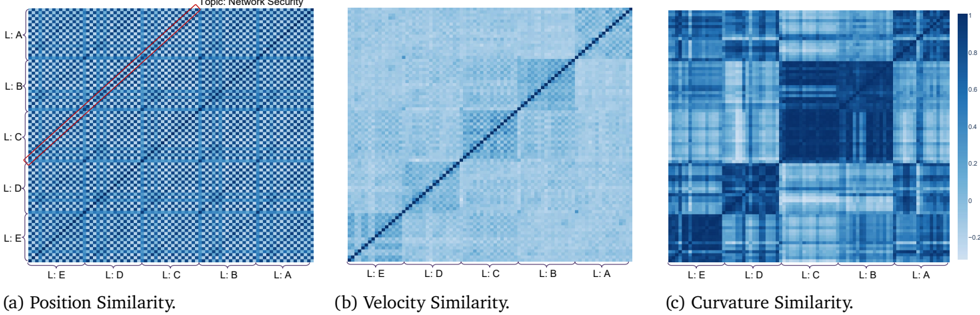
The image presents three heatmaps, each visualizing a different type of similarity (position, velocity, and curvature) within a network security context. The heatmaps use a blue color gradient to represent similarity scores, with darker shades indicating higher similarity. The axes of each heatmap are labeled with categories L: A, L: B, L: C, L: D, and L: E, representing different entities or aspects within the network.
### Components/Axes
* **Title:** The overall topic is "Topic: Network Security" (located in the top-right corner of the first heatmap).
* **Heatmaps:** There are three heatmaps arranged horizontally.
* (a) Position Similarity.
* (b) Velocity Similarity.
* (c) Curvature Similarity.
* **Axes Labels:** Each heatmap has the same labels on both the x and y axes: L: A, L: B, L: C, L: D, L: E.
* **Color Scale:** A color scale is present to the right of the "Curvature Similarity" heatmap. The scale ranges from approximately -0.2 to 0.8, with darker blues representing higher values. The scale is marked at -0.2, 0, 0.2, 0.4, 0.6, and 0.8.
### Detailed Analysis
#### (a) Position Similarity
* **Trend:** This heatmap shows a relatively uniform distribution of similarity scores. There is a diagonal line of slightly darker blue, indicating higher similarity between the same categories (L:A with L:A, L:B with L:B, etc.).
* **Data Points:**
* The diagonal elements (L:A-L:A, L:B-L:B, L:C-L:C, L:D-L:D, L:E-L:E) show slightly higher similarity, with a light-blue color.
* The off-diagonal elements show a more uniform, lighter blue, indicating lower similarity.
* **Additional Notes:** A red line is drawn over the heatmap, starting from the top-right corner (L:A) and extending diagonally downwards to the left, ending between L:C and L:D.
#### (b) Velocity Similarity
* **Trend:** This heatmap shows a stronger diagonal line of high similarity compared to the "Position Similarity" heatmap. There are also some off-diagonal regions with higher similarity.
* **Data Points:**
* The diagonal elements (L:A-L:A, L:B-L:B, L:C-L:C, L:D-L:D, L:E-L:E) show high similarity, with a dark-blue color.
* The off-diagonal elements show varying degrees of similarity, with some regions showing higher similarity than others.
* **Additional Notes:** The overall color intensity is darker than the "Position Similarity" heatmap.
#### (c) Curvature Similarity
* **Trend:** This heatmap shows a more complex pattern of similarity scores, with distinct clusters of high and low similarity.
* **Data Points:**
* The diagonal elements (L:A-L:A, L:B-L:B, L:C-L:C, L:D-L:D, L:E-L:E) show varying degrees of similarity, with some being high and others being low.
* There are distinct blocks of high similarity (dark blue) and low similarity (light blue) in the off-diagonal regions.
* For example, the region corresponding to L:E and L:E shows a high degree of similarity.
* **Additional Notes:** This heatmap has the most complex structure, suggesting more intricate relationships in curvature similarity.
### Key Observations
* The diagonal elements in all three heatmaps generally show higher similarity, as expected.
* The "Velocity Similarity" heatmap shows the strongest diagonal, indicating that velocity is a key factor in determining similarity.
* The "Curvature Similarity" heatmap shows the most complex pattern, suggesting that curvature is influenced by multiple factors.
* The red line on the "Position Similarity" heatmap is an annotation, but its specific meaning is unclear without additional context.
### Interpretation
The heatmaps provide a visual representation of the similarity between different entities (L: A, L: B, L: C, L: D, L: E) based on their position, velocity, and curvature within a network security context. The data suggests that velocity is a strong indicator of similarity, while curvature exhibits more complex relationships. The patterns observed in these heatmaps could be used to identify anomalies, classify network traffic, or understand the behavior of different network components. The "Topic: Network Security" suggests that these L:A to L:E labels are features or components of a network being analyzed for security purposes. The varying similarity based on position, velocity, and curvature could indicate different types of network behavior or potential security threats.