TECHNICAL ASSET FINGERPRINT
f91cb898fc84e7a6a2744589
Click to view fullscreen
Press ESC or click to close
FOUND IN PAPERS
EXPERT: healer-alpha-free VERSION 1
RUNTIME: free/openrouter/healer-alpha
INTEL_VERIFIED
## Heatmap Comparison: Position, Velocity, and Curvature Similarity
### Overview
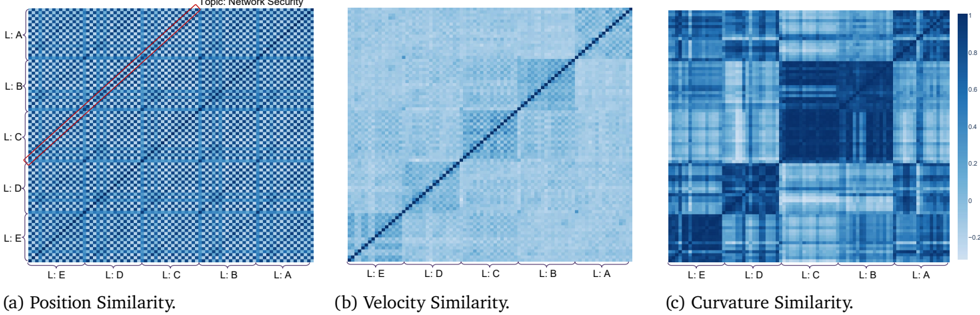
The image displays three square heatmap matrices arranged horizontally, each visualizing a different type of similarity metric. The heatmaps are labeled (a) Position Similarity, (b) Velocity Similarity, and (c) Curvature Similarity. A shared color scale bar is positioned to the right of the third heatmap. The overall context, as indicated by faint text in the top-right corner of the first heatmap, is "Topic: Network security."
### Components/Axes
* **Titles:** Each heatmap has a centered caption below it: "(a) Position Similarity.", "(b) Velocity Similarity.", "(c) Curvature Similarity."
* **Axes Labels (Identical for all three heatmaps):**
* **Y-axis (Vertical, Left side):** Labels from top to bottom are `L:A`, `L:B`, `L:C`, `L:D`, `L:E`.
* **X-axis (Horizontal, Bottom):** Labels from left to right are `L:E`, `L:D`, `L:C`, `L:B`, `L:A`.
* **Color Scale/Legend:** A vertical color bar is located to the right of heatmap (c). It maps color intensity to numerical similarity values.
* **Scale Range:** Approximately -0.2 to 0.8.
* **Key Values:** The bar is marked at intervals: -0.2, 0, 0.2, 0.4, 0.6, 0.8.
* **Color Mapping:** Dark blue represents high similarity (~0.8), medium blue represents moderate similarity (~0.4), light blue/white represents low similarity (~0), and the lightest blue represents negative similarity (~-0.2).
* **Spatial Layout:** The three heatmaps are placed side-by-side. The color bar is positioned to the immediate right of the third heatmap (c). The axis labels are placed outside the grid cells on the left and bottom edges.
### Detailed Analysis
**1. Heatmap (a): Position Similarity**
* **Visual Trend:** The matrix exhibits a highly regular, fine-grained checkered or "salt-and-pepper" pattern across its entire area. A distinct, solid red line runs diagonally from the top-left corner to the bottom-right corner.
* **Data Pattern:** The diagonal (where row and column labels match, e.g., L:A vs L:A) is dark blue, indicating perfect self-similarity (~0.8). The off-diagonal cells show a rapid, alternating pattern of high (dark blue) and low (light blue/white) similarity values. This suggests that the "Position" metric yields very high or very low similarity between most pairs of items (L:A through L:E), with little middle ground. The red diagonal line emphasizes the axis of perfect self-similarity.
**2. Heatmap (b): Velocity Similarity**
* **Visual Trend:** This matrix shows a more structured, block-like pattern compared to (a). The diagonal is again a solid dark blue line.
* **Data Pattern:** The off-diagonal areas are organized into larger, rectangular blocks of relatively uniform color. For example, the top-left quadrant (rows L:A-L:B, columns L:E-L:D) is a lighter blue block, indicating moderate similarity within that group. The central area (around L:C) shows a darker blue block, suggesting higher similarity among items in the middle of the list. The pattern indicates that "Velocity" similarity clusters items into broader groups with more consistent internal similarity.
**3. Heatmap (c): Curvature Similarity**
* **Visual Trend:** This matrix displays the most pronounced and distinct block structure of the three. The diagonal is dark blue.
* **Data Pattern:** There are very clear, large rectangular blocks of dark blue (high similarity) and light blue (low similarity). A prominent dark blue block is centered in the matrix, spanning roughly rows L:B-L:D and columns L:C-L:A. This indicates a cluster of items (L:B, L:C, L:D) that have very high curvature similarity with each other and with L:A. Conversely, the top-left and bottom-right corners are lighter, showing lower similarity between the extremes of the list (e.g., L:A vs L:E). The "Curvature" metric reveals strong, modular relationships.
### Key Observations
1. **Diagonal Consistency:** All three heatmaps have a dark blue diagonal, confirming that each item has maximum similarity with itself (~0.8).
2. **Pattern Progression:** There is a clear visual progression from a noisy, high-frequency pattern in (a) Position, to a medium-block structure in (b) Velocity, to a coarse, well-defined block structure in (c) Curvature. This suggests the metrics capture different levels of granularity in the relationships between the items L:A through L:E.
3. **Color Scale Application:** The color bar on the right applies to all three heatmaps. The darkest blue in each matrix corresponds to the top of the scale (~0.8), while the lightest areas correspond to values near or below 0.
4. **Axis Symmetry:** The axes are symmetric but reversed (Y: A→E, X: E→A). This means the matrix is not a standard symmetric matrix where `similarity(X,Y) = similarity(Y,X)` unless the underlying data is symmetric. The visual patterns, however, appear largely symmetric across the main diagonal.
### Interpretation
These heatmaps likely visualize the similarity of different entities (labeled L:A through L:E) within a network security context, as measured by three distinct metrics: Position, Velocity, and Curvature.
* **Position Similarity (a)** suggests the entities are either very similar or very dissimilar based on their "position," with little middle ground. This could represent discrete states, categories, or locations in a network where items are either co-located or not. The checkered pattern implies a highly structured, possibly binary or alternating relationship.
* **Velocity Similarity (b)** reveals that the entities form broader clusters or communities when considering their "velocity." This metric might relate to the rate of change, propagation speed, or behavioral dynamics. The block structure indicates groups of entities that behave similarly over time.
* **Curvature Similarity (c)** shows the strongest modular organization. "Curvature" might refer to a topological or geometric property of the network or data flow. The distinct dark blue block indicates a core group of entities (L:B, L:C, L:D) that are tightly interrelated by this metric, forming a cohesive unit or functional module within the larger system.
**Overall Implication:** The progression from (a) to (c) demonstrates that different analytical lenses (Position, Velocity, Curvature) reveal fundamentally different structures within the same set of network security entities. Position shows fine-grained, possibly noisy relationships; Velocity reveals intermediate-scale grouping; and Curvature exposes high-level, robust modular architecture. This multi-metric analysis is crucial for understanding complex systems, as no single metric captures the full relational picture. The "Curvature" metric, in particular, appears most effective at identifying a core cluster of highly interdependent components.
DECODING INTELLIGENCE...