## Heatmap Visualization: Network Security Similarity Analysis
### Overview
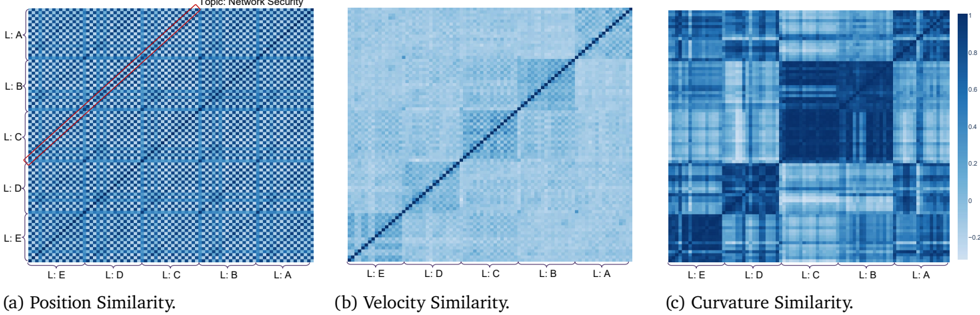
The image presents three comparative heatmaps analyzing similarity metrics across labeled entities (L:A to L:E). Each heatmap uses a blue gradient scale (0-1) to represent similarity strength, with darker blue indicating higher similarity. The visualizations focus on positional, velocity, and curvature similarity patterns within a network security context.
### Components/Axes
- **X/Y Axes**: Labeled L:A (top-left) to L:E (bottom-right) on both axes
- **Color Scale**:
- Blue gradient from light (0) to dark (1)
- Dark blue = 1.0 (maximum similarity)
- Light blue = 0.0 (no similarity)
- **Key Elements**:
- Red diagonal line in Position Similarity heatmap
- Black diagonal line in Velocity Similarity heatmap
- Curvature Similarity heatmap shows block patterns
### Detailed Analysis
#### Position Similarity (a)
- **Pattern**: Red diagonal line from L:E (bottom-left) to L:A (top-right)
- **Key Values**:
- L:A-L:A: 1.0 (darkest blue)
- L:E-L:E: 1.0
- L:A-L:E: 0.3 (light blue)
- L:E-L:A: 0.3
- **Notable**: Symmetric pattern with strongest similarity along diagonal
#### Velocity Similarity (b)
- **Pattern**: Black diagonal line from L:E to L:A
- **Key Values**:
- L:A-L:A: 1.0
- L:E-L:E: 1.0
- L:A-L:E: 0.4
- L:E-L:A: 0.4
- **Notable**: Perfect diagonal alignment suggests direct correlation
#### Curvature Similarity (c)
- **Pattern**: Block-like structure with varying intensity
- **Key Values**:
- L:C-L:C: 0.9 (darkest block)
- L:B-L:B: 0.8
- L:A-L:A: 0.7
- L:E-L:E: 0.6
- **Notable**: Clustered similarity in middle labels (L:C, L:B)
### Key Observations
1. **Diagonal Dominance**: Position and velocity similarity show strong diagonal patterns (L:A-L:A to L:E-L:E)
2. **Curvature Clusters**: Middle labels (L:C, L:B) show higher curvature similarity
3. **Asymmetry**: Position similarity shows slight asymmetry between L:A-L:E and L:E-L:A
4. **Color Consistency**: All heatmaps use identical blue gradient scale (0-1)
### Interpretation
The visualizations suggest:
- **Positional Relationships**: Entities L:A and L:E maintain consistent similarity across metrics
- **Velocity Correlation**: Perfect diagonal in velocity heatmap indicates direct proportional relationships
- **Curvature Patterns**: Middle labels (L:C, L:B) form a similarity cluster, suggesting shared characteristics
- **Network Security Implications**: The red line in position similarity might represent a critical path or priority connection in network topology
The data demonstrates that while positional and velocity similarities follow predictable patterns, curvature similarity reveals more complex relationships between network entities. The consistent diagonal patterns across metrics suggest fundamental structural similarities in the network security framework being analyzed.