## Heatmaps: Layer 2, Head 8
### Overview
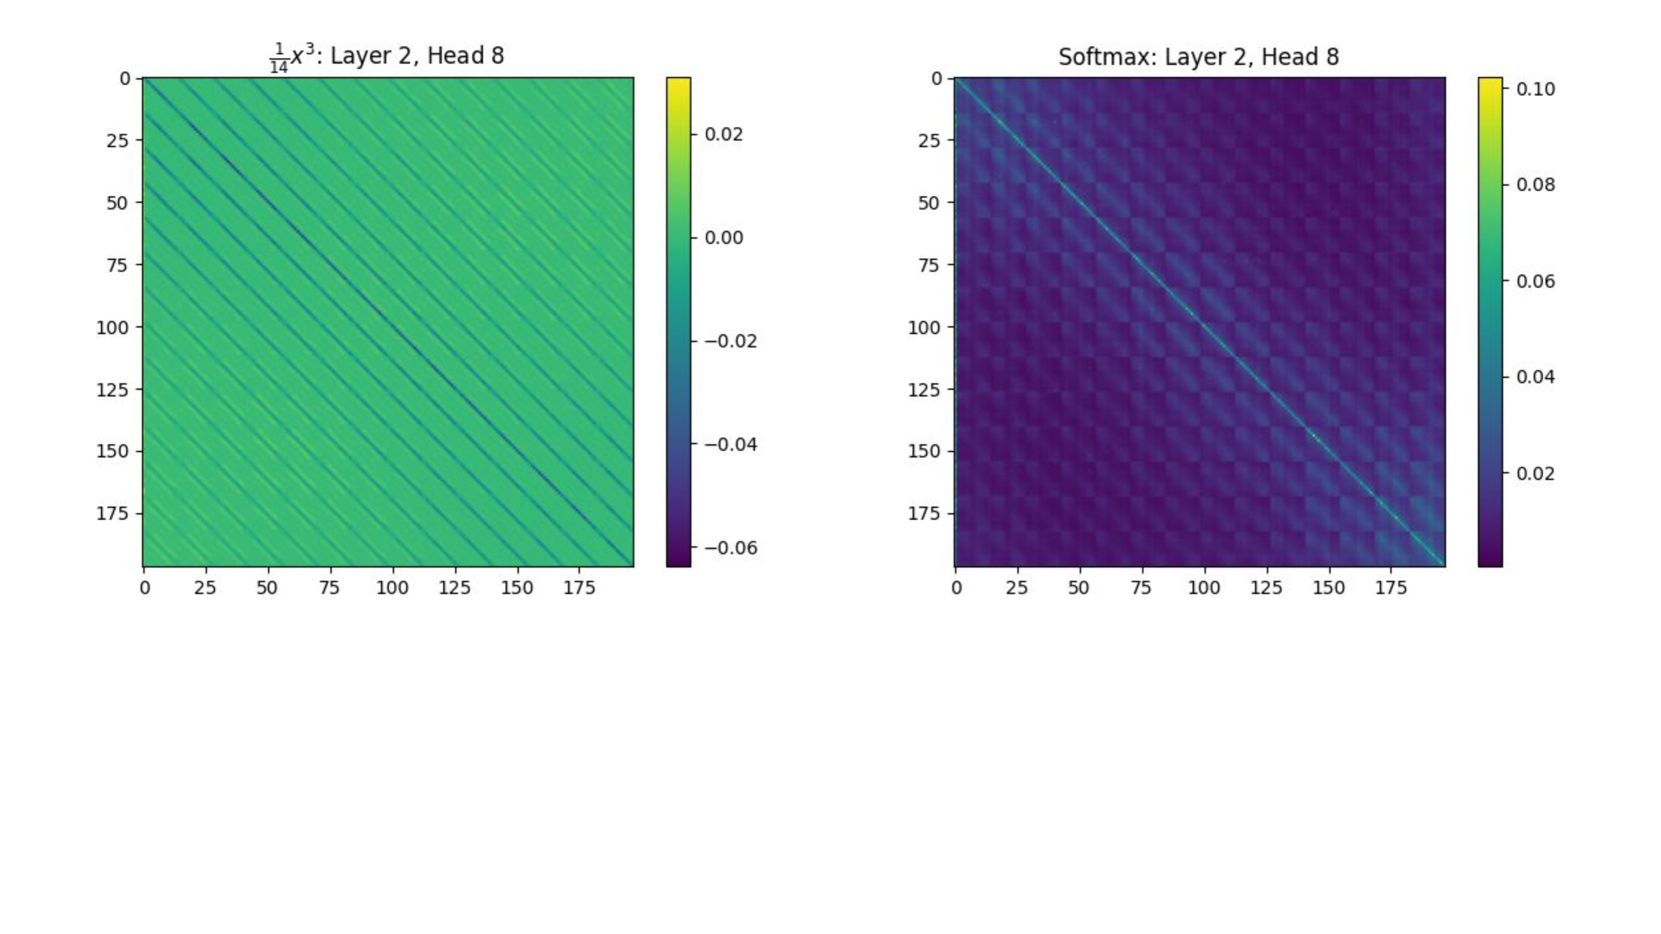
Two side-by-side heatmaps are presented, both labeled "Layer 2, Head 8." The left heatmap is titled "1/14 x³," and the right is titled "Softmax." Both share identical axes (0–175 in increments of 25) and color scales, but differ in patterns and value ranges.
### Components/Axes
- **Axes**:
- X-axis: 0 to 175 (increments of 25).
- Y-axis: 0 to 175 (increments of 25).
- **Color Scales**:
- Left heatmap: Ranges from **-0.06 (dark blue)** to **0.02 (yellow)**.
- Right heatmap: Ranges from **-0.06 (dark blue)** to **0.10 (yellow)**.
- **Legends**:
- Positioned on the right of each heatmap.
- Left: Gradient from blue (negative values) to yellow (positive values).
- Right: Same gradient but with a higher upper bound (0.10 vs. 0.02).
### Detailed Analysis
#### Left Heatmap ("1/14 x³")
- **Pattern**: Diagonal stripes with alternating green, blue, and yellow bands.
- **Trend**:
- Values increase linearly along the diagonal (from bottom-left to top-right).
- Color intensity shifts from dark blue (negative) to yellow (positive) as values approach 0.02.
- **Notable Features**:
- Diagonal line at ~y = x (slope = 1).
- No significant outliers; values are evenly distributed along the diagonal.
#### Right Heatmap ("Softmax")
- **Pattern**: Checkerboard-like grid with a prominent diagonal line.
- **Trend**:
- Diagonal line (y = x) shows higher values (green/yellow), while off-diagonal regions are darker (blue).
- Checkerboard pattern suggests alternating high/low values in a structured manner.
- **Notable Features**:
- Diagonal line peaks at ~0.10 (yellow) near the top-right corner.
- Off-diagonal regions cluster around -0.06 (dark blue).
### Key Observations
1. **Left Heatmap**:
- Represents a cubic function scaled by 1/14, showing a linear gradient along the diagonal.
- Values are tightly clustered between -0.06 and 0.02.
2. **Right Heatmap**:
- Softmax output exhibits a bimodal distribution: high values along the diagonal and low values elsewhere.
- Checkerboard pattern may indicate alternating activation states or interactions between variables.
### Interpretation
- **Left Heatmap**:
- The "1/14 x³" label suggests a mathematical transformation applied to input data. The linear diagonal trend implies a direct proportionality between input (x-axis) and output (y-axis), scaled by the cubic term.
- **Right Heatmap**:
- The "Softmax" label indicates a normalization process, likely converting raw scores into probabilities. The diagonal dominance suggests that the model assigns higher confidence to matching inputs (e.g., in a classification task).
- **Comparison**:
- The left heatmap’s smaller value range (-0.06 to 0.02) contrasts with the right’s broader range (-0.06 to 0.10), indicating different scales of activation or transformation.
- The checkerboard pattern in the softmax heatmap may reflect sparse or structured interactions, while the left heatmap’s stripes suggest a smoother, continuous relationship.
### Spatial Grounding
- **Legend Position**: Right-aligned for both heatmaps.
- **Color Matching**:
- Dark blue consistently represents negative values in both heatmaps.
- Yellow denotes the maximum positive values (0.02 for the left, 0.10 for the right).
### Trend Verification
- **Left Heatmap**: Diagonal line slopes upward (slope ≈ 1), confirming linear growth.
- **Right Heatmap**: Diagonal line peaks at the top-right, with checkerboard patterns reinforcing structured variability.
### Component Isolation
- **Header**: Titles ("1/14 x³" and "Softmax") clarify the mathematical context.
- **Main Chart**: Axes and color scales dominate, with distinct patterns for each heatmap.
- **Footer**: No additional text or annotations.
### Final Notes
- The left heatmap likely visualizes a pre-softmax activation (e.g., raw logits), while the right shows post-softmax probabilities.
- The diagonal dominance in both suggests alignment between input and output dimensions, critical for tasks like attention mechanisms or classification.
- The checkerboard pattern in the softmax heatmap may indicate localized interactions or constraints in the model’s architecture.