## Chart: Scaling up Test-Time Compute with Recurrent Depth
### Overview
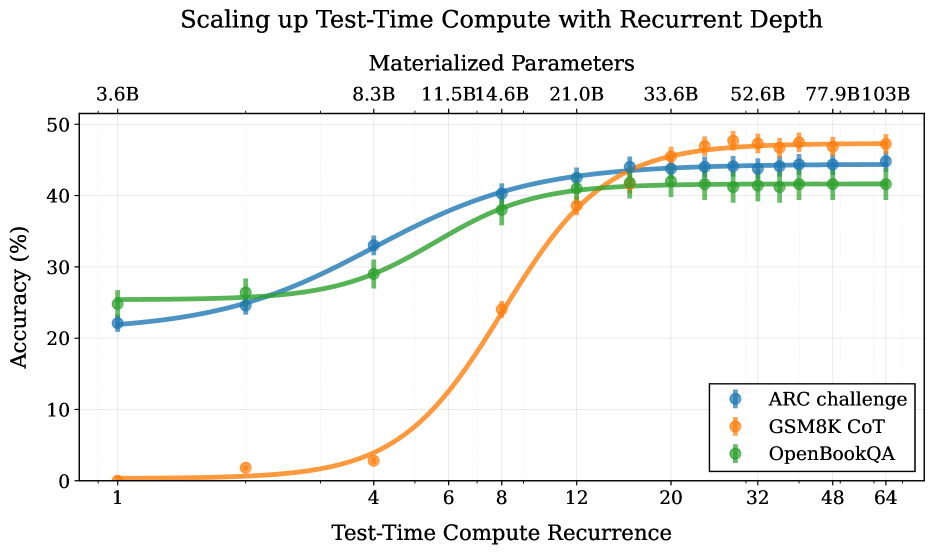
The image is a line chart comparing the accuracy of three different models (ARC challenge, GSM8K CoT, and OpenBookQA) as a function of Test-Time Compute Recurrence. The x-axis represents the Test-Time Compute Recurrence, and the y-axis represents the Accuracy (%). The chart also displays the Materialized Parameters along the top x-axis.
### Components/Axes
* **Title:** Scaling up Test-Time Compute with Recurrent Depth
* **X-axis Title:** Test-Time Compute Recurrence
* X-axis values: 1, 4, 6, 8, 12, 20, 32, 48, 64
* **Y-axis Title:** Accuracy (%)
* Y-axis values: 0, 10, 20, 30, 40, 50
* **Secondary X-axis Title:** Materialized Parameters
* Secondary X-axis values: 3.6B, 8.3B, 11.5B, 14.6B, 21.0B, 33.6B, 52.6B, 77.9B, 103B
* **Legend:** Located in the bottom-right corner.
* Blue: ARC challenge
* Orange: GSM8K CoT
* Green: OpenBookQA
### Detailed Analysis
**ARC challenge (Blue):**
The blue line represents the "ARC challenge" model. The line generally slopes upward, indicating that accuracy increases with Test-Time Compute Recurrence.
* At x=1, Accuracy is approximately 22%.
* At x=4, Accuracy is approximately 33%.
* At x=8, Accuracy is approximately 38%.
* From x=20 onwards, the accuracy plateaus at approximately 47%.
**GSM8K CoT (Orange):**
The orange line represents the "GSM8K CoT" model. The line shows a steep upward trend, indicating a rapid increase in accuracy with Test-Time Compute Recurrence.
* At x=1, Accuracy is approximately 0%.
* At x=4, Accuracy is approximately 1%.
* At x=8, Accuracy is approximately 25%.
* From x=20 onwards, the accuracy plateaus at approximately 47%.
**OpenBookQA (Green):**
The green line represents the "OpenBookQA" model. The line shows a gradual upward trend, indicating a moderate increase in accuracy with Test-Time Compute Recurrence.
* At x=1, Accuracy is approximately 25%.
* At x=4, Accuracy is approximately 26%.
* At x=8, Accuracy is approximately 38%.
* From x=20 onwards, the accuracy plateaus at approximately 42%.
### Key Observations
* The GSM8K CoT model (orange line) shows the most significant improvement in accuracy as Test-Time Compute Recurrence increases, starting from a very low initial accuracy.
* The ARC challenge (blue line) and OpenBookQA (green line) models have higher initial accuracies but show less dramatic improvements with increased Test-Time Compute Recurrence.
* All three models plateau in accuracy after a certain level of Test-Time Compute Recurrence (around x=20).
* The Materialized Parameters increase along with the Test-Time Compute Recurrence.
### Interpretation
The chart suggests that increasing Test-Time Compute Recurrence can improve the accuracy of certain models, particularly those that start with lower initial accuracies. The GSM8K CoT model benefits the most from increased compute, while the ARC challenge and OpenBookQA models show more modest gains. The plateauing of accuracy for all models indicates that there are diminishing returns to increasing Test-Time Compute Recurrence beyond a certain point. The Materialized Parameters are correlated with the Test-Time Compute Recurrence, suggesting that increased compute requires more parameters.