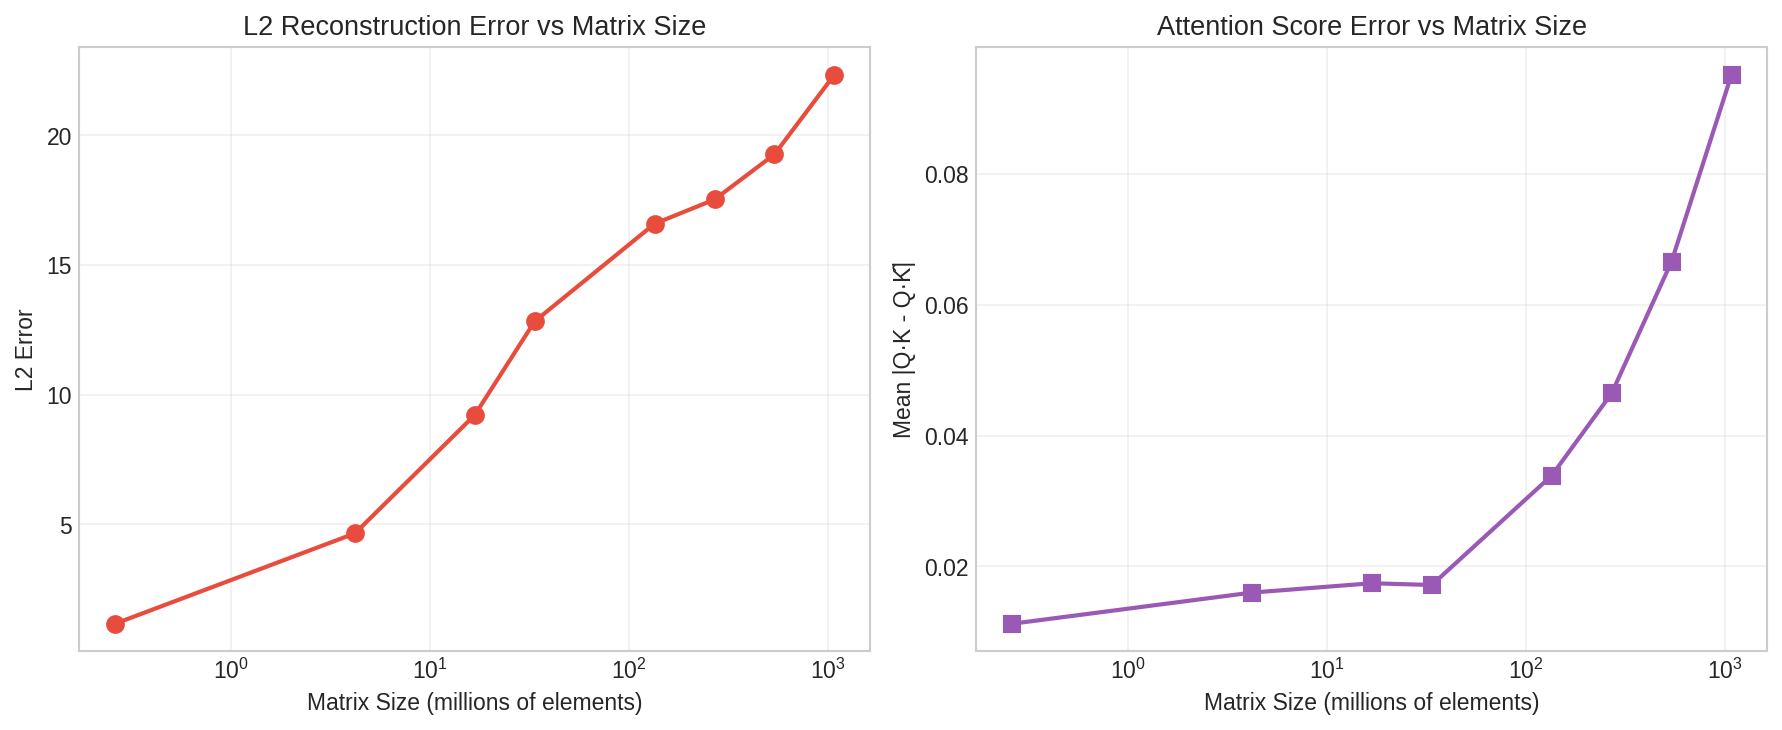
## Line Charts: L2 Reconstruction Error vs Matrix Size and Attention Score Error vs Matrix Size
### Overview
The image contains two line charts comparing error metrics (L2 Reconstruction Error and Attention Score Error) against matrix size (measured in millions of elements). Both charts use logarithmic scales for the x-axis (matrix size) and linear scales for the y-axis (error metrics). The left chart shows a red line representing L2 Reconstruction Error, while the right chart uses a purple line for Attention Score Error.
### Components/Axes
#### Left Chart (L2 Reconstruction Error):
- **X-axis**: Matrix Size (millions of elements)
- Logarithmic scale: 10⁰ (1 million), 10¹ (10 million), 10² (100 million), 10³ (1,000 million).
- **Y-axis**: L2 Error
- Linear scale: 0 to 22.
- **Line**: Red, with markers at each data point.
#### Right Chart (Attention Score Error):
- **X-axis**: Matrix Size (millions of elements)
- Logarithmic scale: 10⁰ (1 million), 10¹ (10 million), 10² (100 million), 10³ (1,000 million).
- **Y-axis**: Mean |Q·K - Q·K|
- Linear scale: 0 to 0.085.
- **Line**: Purple, with markers at each data point.
### Detailed Analysis
#### Left Chart (L2 Reconstruction Error):
- **Trend**: The error increases monotonically with matrix size.
- At 1 million elements: ~1.5.
- At 10 million elements: ~5.
- At 100 million elements: ~9.
- At 1,000 million elements: ~22.
#### Right Chart (Attention Score Error):
- **Trend**: The error remains relatively stable for smaller matrices but spikes sharply at the largest size.
- At 1 million elements: ~0.01.
- At 10 million elements: ~0.015.
- At 100 million elements: ~0.017.
- At 1,000 million elements: ~0.085.
### Key Observations
1. **L2 Reconstruction Error**:
- Errors grow steadily as matrix size increases, with a ~14.5x increase from 100 million to 1,000 million elements.
2. **Attention Score Error**:
- Errors remain stable until the largest matrix size, where they increase by ~400% (from 0.017 to 0.085).
3. **Scale Sensitivity**:
- Both charts use logarithmic x-axes, emphasizing exponential growth in matrix size.
### Interpretation
The data suggests that larger matrix sizes correlate with increased errors in both L2 reconstruction and attention scores. However, the attention score error exhibits a critical threshold effect at the largest matrix size (1,000 million elements), where errors surge dramatically. This could indicate:
- **Scalability Limits**: The model may struggle with computational or memory constraints at extreme scales.
- **Attention Mechanism Instability**: The sharp rise in attention score error might reflect degradation in the model's ability to maintain coherent relationships between elements in very large matrices.
- **Practical Implications**: While the model performs reasonably well up to 100 million elements, its reliability diminishes significantly beyond this point, highlighting the need for optimization or architectural adjustments for large-scale applications.
### Spatial Grounding
- **Legend**: No explicit legend is present, but colors are visually distinct (red for L2, purple for attention score).
- **Positioning**:
- Left chart occupies the left half of the image; right chart occupies the right half.
- Both charts share identical x-axis labels and logarithmic scaling.
### Content Details
- **Data Points**:
- Left chart: (1e0, 1.5), (1e1, 5), (1e2, 9), (1e3, 22).
- Right chart: (1e0, 0.01), (1e1, 0.015), (1e2, 0.017), (1e3, 0.085).
- **Trend Verification**:
- Left chart slopes upward consistently.
- Right chart remains flat until the final data point, where it rises sharply.
### Final Notes
The absence of a legend or explicit error bars limits precision in interpreting variability. However, the clear visual trends suggest a strong relationship between matrix size and error magnitude, with critical implications for model design at scale.