\n
## Line Chart: Surprisal vs. Training Steps
### Overview
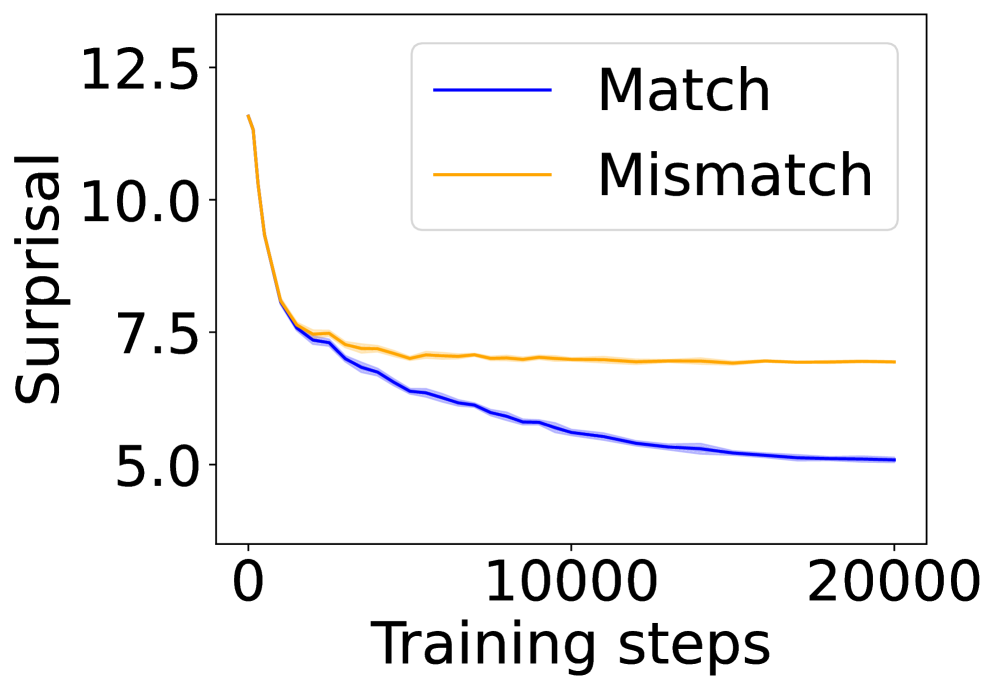
The image presents a line chart illustrating the relationship between "Surprisal" (y-axis) and "Training steps" (x-axis). Two data series are plotted: one representing "Match" and the other "Mismatch". The chart appears to track how surprisal changes during a training process.
### Components/Axes
* **X-axis:** "Training steps", ranging from approximately 0 to 20000. The axis is linearly scaled.
* **Y-axis:** "Surprisal", ranging from approximately 5.0 to 12.5. The axis is linearly scaled.
* **Legend:** Located in the top-right corner of the chart.
* "Match" - represented by a blue line.
* "Mismatch" - represented by an orange line.
### Detailed Analysis
The "Match" line (blue) starts at approximately 7.2 at 0 training steps and decreases steadily to approximately 5.2 at 20000 training steps. The slope is generally consistent, indicating a relatively stable rate of decrease.
The "Mismatch" line (orange) begins at approximately 10.2 at 0 training steps and decreases to approximately 6.8 at 20000 training steps. The initial decrease is steeper than the "Match" line, but the rate of decrease slows down as training progresses.
Here's a breakdown of approximate data points:
**Match (Blue Line):**
* 0 Training Steps: Surprisal ≈ 7.2
* 5000 Training Steps: Surprisal ≈ 6.4
* 10000 Training Steps: Surprisal ≈ 5.8
* 15000 Training Steps: Surprisal ≈ 5.5
* 20000 Training Steps: Surprisal ≈ 5.2
**Mismatch (Orange Line):**
* 0 Training Steps: Surprisal ≈ 10.2
* 5000 Training Steps: Surprisal ≈ 8.5
* 10000 Training Steps: Surprisal ≈ 7.5
* 15000 Training Steps: Surprisal ≈ 7.1
* 20000 Training Steps: Surprisal ≈ 6.8
### Key Observations
* Both "Match" and "Mismatch" exhibit decreasing surprisal as training steps increase. This suggests that the model is learning and becoming more confident in its predictions over time.
* The "Mismatch" line consistently has a higher surprisal value than the "Match" line throughout the entire training process. This indicates that mismatches are inherently more surprising or less predictable than matches.
* The rate of decrease in surprisal slows down for both lines as training progresses, suggesting diminishing returns from further training.
### Interpretation
The chart demonstrates the impact of training on reducing surprisal for both matching and mismatching scenarios. The higher initial surprisal for mismatches suggests that the model initially struggles to differentiate between correct and incorrect pairings. As training progresses, the model learns to better predict matches, leading to a decrease in surprisal for both categories. The fact that surprisal remains higher for mismatches even after extensive training suggests that mismatches are fundamentally more difficult to predict, potentially due to inherent ambiguity or complexity in the data. The diminishing returns observed towards the end of the training process indicate that further training may not yield significant improvements in performance. This could be a signal to stop training and evaluate the model's performance. The chart is a valuable tool for monitoring the learning process and identifying potential areas for improvement.