\n
## Line Chart: Performance Metrics vs. Decoding Beam Size
### Overview
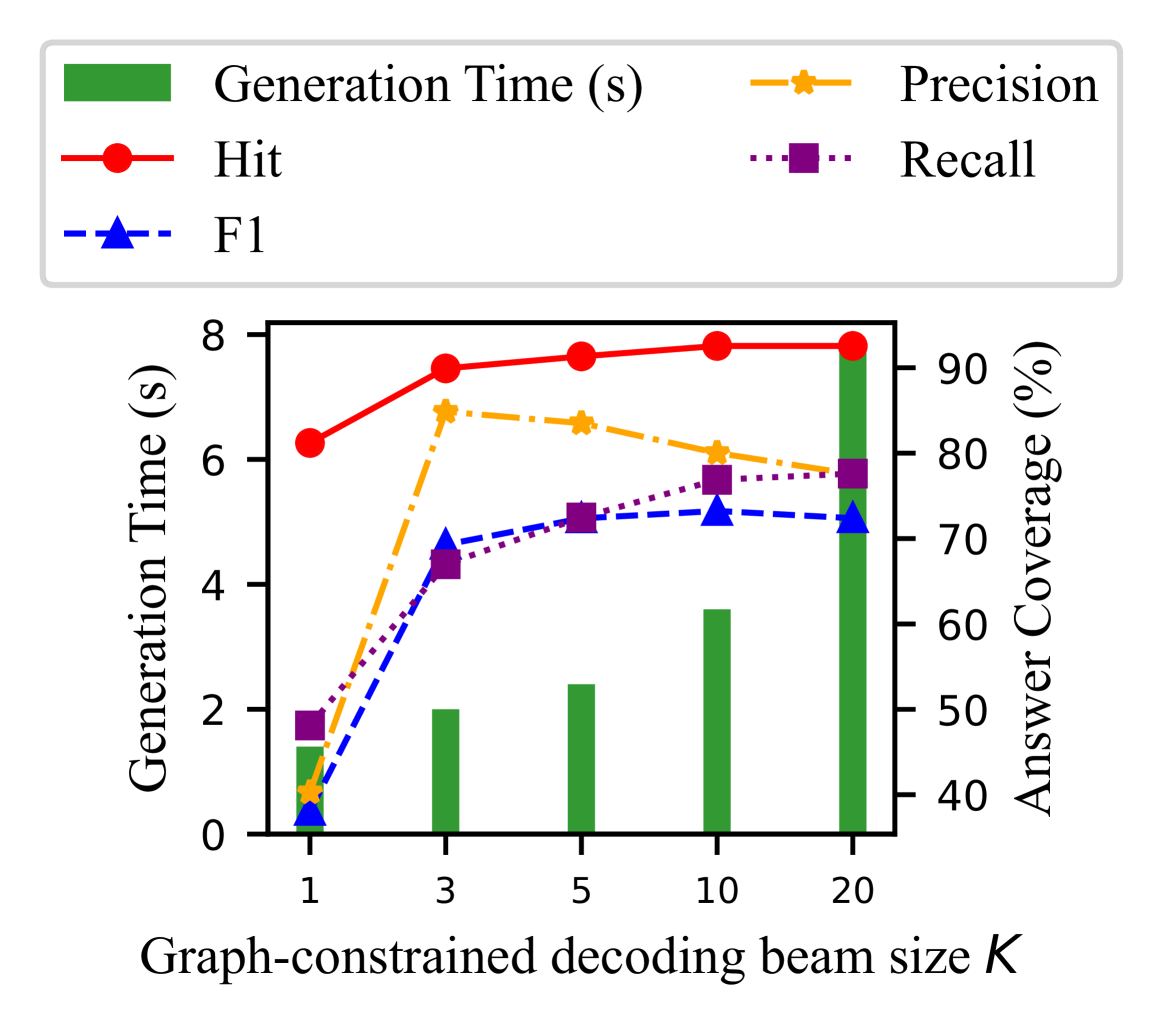
This chart displays the relationship between Graph-constrained decoding beam size (K) and several performance metrics: Generation Time, Hit, Precision, Recall, and F1 score. The chart uses a dual y-axis, with Generation Time on the left and Answer Coverage (representing Precision, Recall, and F1) on the right.
### Components/Axes
* **X-axis:** Graph-constrained decoding beam size K, with markers at 1, 3, 5, 10, and 20.
* **Y-axis (left):** Generation Time (s), ranging from 0 to 8.
* **Y-axis (right):** Answer Coverage (%), ranging from 40 to 90.
* **Legend:** Located in the top-right corner.
* Green: Generation Time (s)
* Red: Hit
* Orange: Precision
* Blue dashed: Recall
* Blue triangle: F1
### Detailed Analysis
* **Generation Time (Green Bars):** The Generation Time increases with increasing beam size.
* K=1: Approximately 0.2 seconds.
* K=3: Approximately 1.8 seconds.
* K=5: Approximately 2.5 seconds.
* K=10: Approximately 3.7 seconds.
* K=20: Approximately 4.2 seconds.
* **Hit (Red Line):** The Hit rate increases rapidly from K=1 to K=3, then plateaus.
* K=1: Approximately 25%.
* K=3: Approximately 70%.
* K=5: Approximately 74%.
* K=10: Approximately 76%.
* K=20: Approximately 78%.
* **Precision (Orange Line):** The Precision increases from K=1 to K=3, then decreases slightly.
* K=1: Approximately 45%.
* K=3: Approximately 72%.
* K=5: Approximately 68%.
* K=10: Approximately 65%.
* K=20: Approximately 63%.
* **Recall (Blue Dashed Line):** The Recall increases steadily with increasing beam size.
* K=1: Approximately 40%.
* K=3: Approximately 55%.
* K=5: Approximately 60%.
* K=10: Approximately 75%.
* K=20: Approximately 78%.
* **F1 (Blue Triangle Line):** The F1 score increases from K=1 to K=3, then plateaus.
* K=1: Approximately 0.
* K=3: Approximately 50%.
* K=5: Approximately 55%.
* K=10: Approximately 68%.
* K=20: Approximately 72%.
### Key Observations
* The Generation Time increases linearly with beam size, suggesting a computational cost associated with larger beam sizes.
* The Hit rate shows diminishing returns after K=3, indicating that increasing the beam size beyond this point provides minimal improvement in hit rate.
* Precision peaks at K=3 and then declines, while Recall continues to increase. This suggests a trade-off between precision and recall as the beam size increases.
* The F1 score, which balances precision and recall, also plateaus after K=3, similar to the Hit rate.
### Interpretation
The data suggests that a beam size of K=3 represents a sweet spot for this graph-constrained decoding task. Increasing the beam size beyond K=3 results in increased Generation Time without significant improvements in Hit rate, F1 score, or overall Answer Coverage. The trade-off between Precision and Recall indicates that larger beam sizes may introduce more false positives (lower precision) while capturing more relevant answers (higher recall). The chart demonstrates the importance of optimizing the beam size to balance computational cost and performance metrics. The plateauing of the Hit, F1, and Precision metrics after K=3 suggests that other factors may become limiting as the beam size increases, such as the quality of the underlying graph or the decoding algorithm itself.