## Line Chart: Performance Metrics vs. Graph-constrained Decoding Beam Size (K)
### Overview
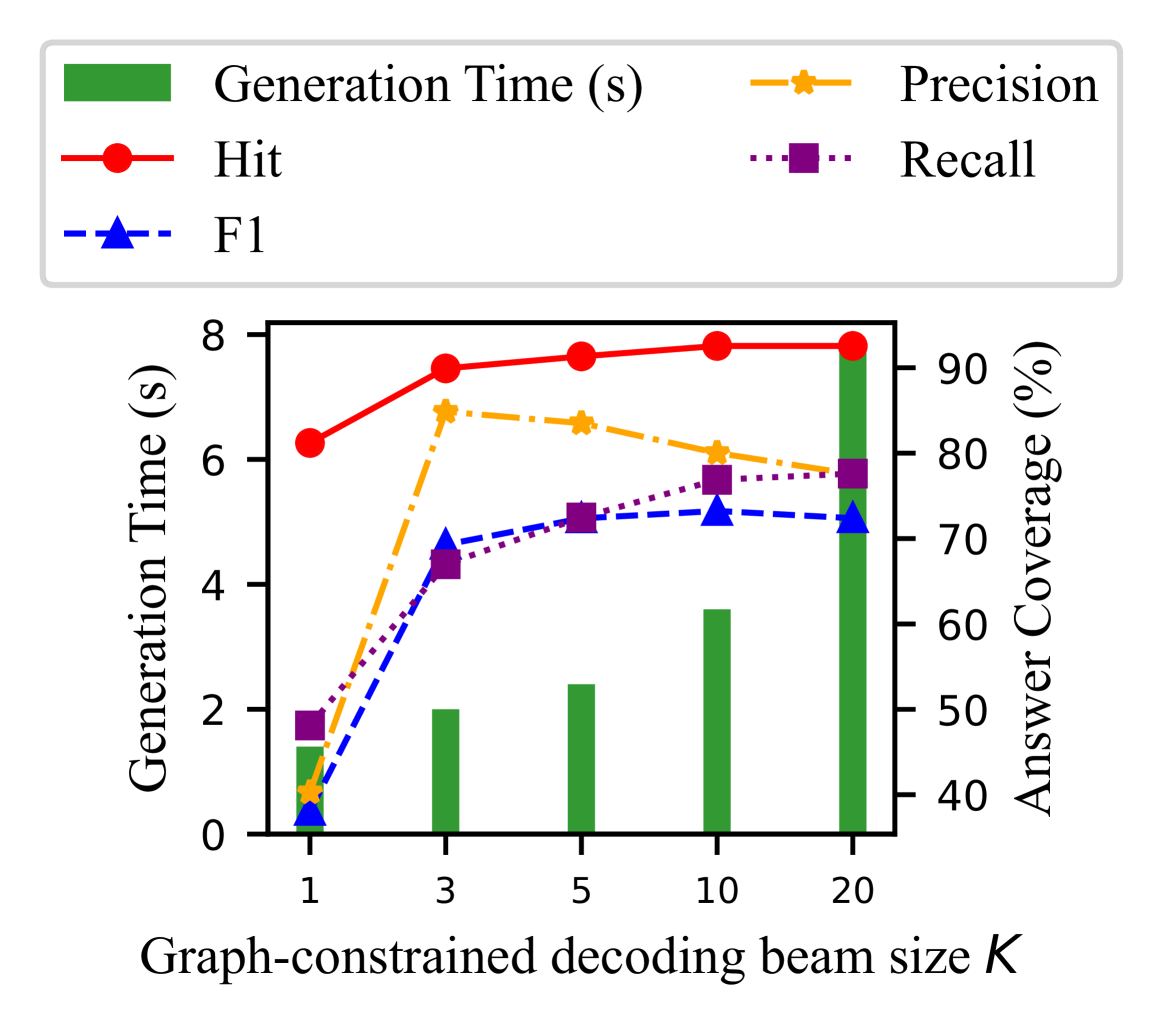
The chart compares multiple performance metrics (Generation Time, Hit Rate, Precision, Recall, F1 Score) across varying graph-constrained decoding beam sizes (K = 1, 3, 5, 10, 20). Two y-axes are used: left for Generation Time (seconds) and right for Answer Coverage (%). Data is represented through bars (Generation Time) and lines with markers (other metrics).
### Components/Axes
- **X-axis**: Graph-constrained decoding beam size K (values: 1, 3, 5, 10, 20)
- **Left Y-axis**: Generation Time (s) [0–8]
- **Right Y-axis**: Answer Coverage (%) [40–90]
- **Legend**:
- Green bars: Generation Time (s)
- Red circles: Hit Rate
- Yellow stars: Precision
- Purple squares: Recall
- Blue triangles: F1 Score
### Detailed Analysis
1. **Generation Time (s)**:
- K=1: ~1.5s (green bar)
- K=3: ~2.0s
- K=5: ~2.5s
- K=10: ~3.5s
- K=20: ~8.0s (sharp increase)
2. **Hit Rate**:
- K=1: ~6.5s (red circle)
- K=3: ~7.5s
- K=5: ~7.8s
- K=10: ~8.0s
- K=20: ~8.0s (plateaus at max)
3. **Precision**:
- K=1: ~50% (yellow star)
- K=3: ~80%
- K=5: ~75%
- K=10: ~65%
- K=20: ~60% (declines after K=3)
4. **Recall**:
- K=1: ~40% (purple square)
- K=3: ~60%
- K=5: ~65%
- K=10: ~70%
- K=20: ~75% (steady increase)
5. **F1 Score**:
- K=1: ~50% (blue triangle)
- K=3: ~65%
- K=5: ~70%
- K=10: ~75% (peak)
- K=20: ~70% (slight drop)
### Key Observations
- **Generation Time** increases non-linearly with K, especially at K=20.
- **Hit Rate** remains consistently high (>7.5s) across all K values.
- **Precision** peaks at K=3 (80%) but declines sharply at higher K.
- **Recall** improves monotonically with K, reaching 75% at K=20.
- **F1 Score** peaks at K=10 (75%) before declining at K=20.
### Interpretation
The data demonstrates a trade-off between computational efficiency and model performance:
1. **Efficiency vs. Coverage**: Larger K improves Answer Coverage (Recall/Precision) but drastically increases Generation Time, particularly at K=20.
2. **Optimal Balance**: K=10 achieves the highest F1 Score (75%), suggesting it balances precision and recall effectively.
3. **Precision Degradation**: Despite improved coverage at higher K, precision drops after K=3, indicating potential over-smoothing or irrelevant node inclusion in the decoding beam.
4. **Hit Rate Stability**: The near-constant Hit Rate (~7.5–8.0s) suggests the model consistently identifies relevant nodes regardless of K, though this metric's definition (e.g., node retrieval accuracy) requires clarification.
The chart highlights the need to optimize K based on application priorities: K=10 for balanced performance, K=3 for precision-critical tasks, or K=20 for maximum coverage despite computational cost.