# Technical Analysis of the Provided Graph
## Axes and Labels
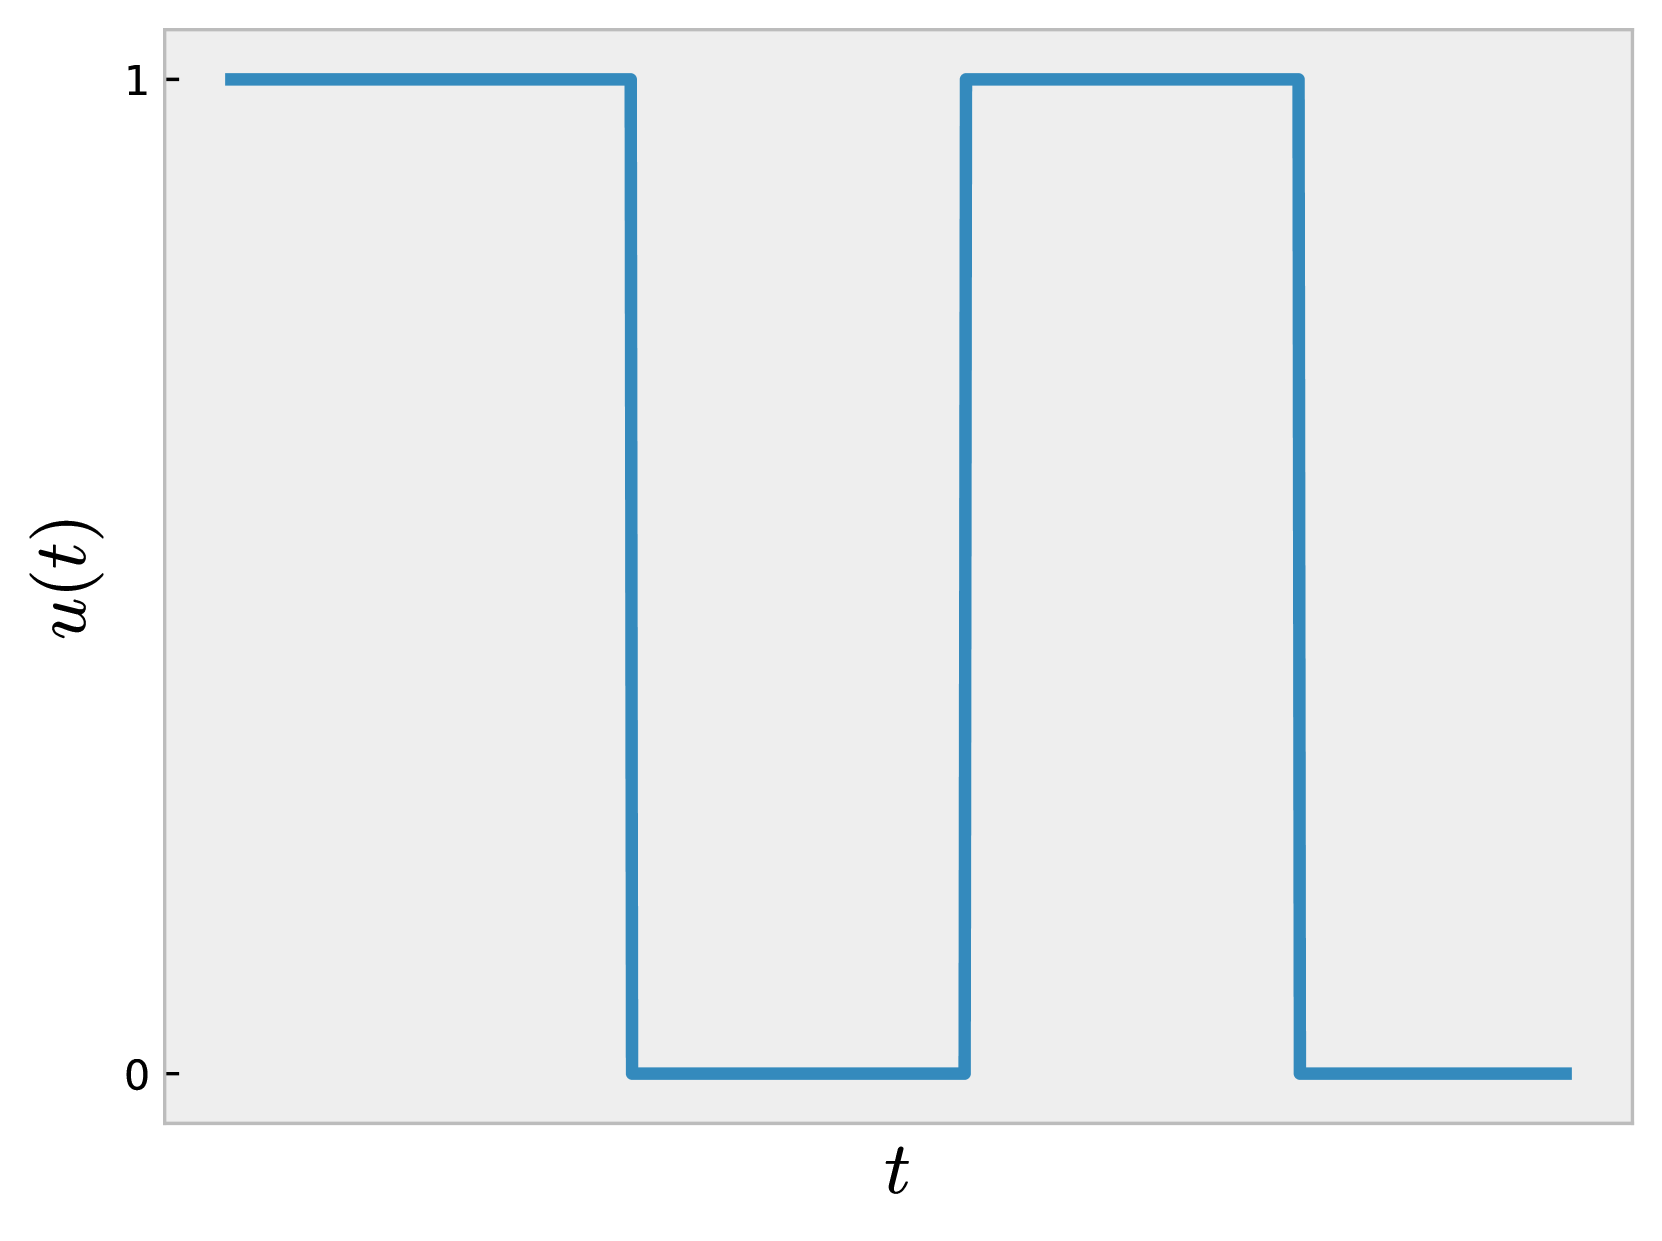
- **Vertical Axis (y-axis):** Labeled as $ u(t) $, representing the dependent variable.
- **Horizontal Axis (x-axis):** Labeled as $ t $, representing time or an independent variable.
- **Units:** No explicit units provided for $ u(t) $ or $ t $.
## Line Description
- **Line Style:** Solid blue line with sharp transitions (no smoothing).
- **Behavior:** Piecewise step function with discontinuities at specific $ t $-values.
- **Key Segments:**
1. **Segment 1:** $ t \in [0, 1) $
- $ u(t) = 1 $ (constant value).
2. **Segment 2:** $ t \in [1, 2) $
- $ u(t) = 0 $ (constant value).
3. **Segment 3:** $ t \in [2, 3) $
- $ u(t) = 1 $ (constant value).
4. **Segment 4:** $ t \geq 3 $
- $ u(t) = 0 $ (constant value).
## Key Data Points and Discontinuities
- **Discontinuities at:**
- $ t = 1 $: Transition from $ u(t) = 1 $ to $ u(t) = 0 $.
- $ t = 2 $: Transition from $ u(t) = 0 $ to $ u(t) = 1 $.
- $ t = 3 $: Transition from $ u(t) = 1 $ to $ u(t) = 0 $.
- **Notable Features:**
- The function alternates between $ u(t) = 1 $ and $ u(t) = 0 $ at integer $ t $-values.
- No intermediate values observed; purely binary states.
## Mathematical Representation
The function $ u(t) $ can be expressed as a piecewise function:
$$
u(t) =
\begin{cases}
1 & \text{if } t \in [0, 1) \cup [2, 3), \\
0 & \text{if } t \in [1, 2) \cup [3, \infty).
\end{cases}
$$
## Observations
- The graph represents a **square wave** with a period of 2 units in $ t $, though the final segment at $ t \geq 3 $ introduces an asymmetry (duration of $ u(t) = 0 $ is longer than subsequent segments).
- No legend or additional annotations present in the image.
## Conclusion
The graph depicts a time-dependent binary signal $ u(t) $ with periodic on/off states, characterized by sharp transitions at integer $ t $-values. The function is fully defined by its piecewise segments and discontinuities.