## Scatter Plot: high_school_psychology
### Overview
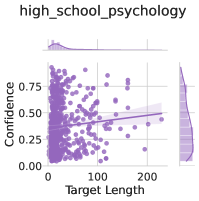
The image is a scatter plot visualizing the relationship between "Target Length" (x-axis) and "Confidence" (y-axis) in a high school psychology context. Purple data points are distributed across the plot, with a trend line indicating a slight positive correlation. Marginal histograms on the top and right edges show distributions of the variables.
### Components/Axes
- **Title**: "high_school_psychology" (top-center).
- **X-axis**: "Target Length" (0 to 200, linear scale).
- **Y-axis**: "Confidence" (0.00 to 0.75, linear scale).
- **Legend**: Located in the top-left corner (color: purple, label unspecified but likely corresponds to the trend line or data points).
- **Trend Line**: A solid purple line with a shaded confidence interval (light purple) spanning the plot.
- **Histograms**:
- Top histogram: Distribution of "Target Length" (peaks near 100).
- Right histogram: Distribution of "Confidence" (peaks near 0.5).
### Detailed Analysis
- **Data Points**:
- Approximately 50-100 purple dots scattered across the plot.
- Concentration of points in the lower-left quadrant (low target length, low confidence) and upper-right quadrant (high target length, high confidence).
- Outliers: A few points with high confidence (y > 0.7) at low target lengths (x < 50) and low confidence (y < 0.25) at high target lengths (x > 150).
- **Trend Line**:
- Slope: Slightly upward (positive correlation).
- Approximate equation: Confidence ≈ 0.002 × Target Length + 0.25 (estimated from endpoints: (0, 0.25) to (200, 0.5)).
- Confidence interval: Shaded area ± ~0.15 around the trend line.
- **Histograms**:
- Top histogram: Bimodal distribution with peaks at ~50 and ~150 target lengths.
- Right histogram: Unimodal distribution peaking at ~0.5 confidence.
### Key Observations
1. **Positive Correlation**: The trend line suggests that longer target lengths are associated with higher confidence, though the relationship is weak (slope ~0.002).
2. **Distribution Patterns**:
- Most data points cluster around target lengths of 100 and confidence levels of 0.5.
- Histograms reveal variability: Target lengths are spread between 0-200, while confidence values are concentrated between 0.25-0.75.
3. **Outliers**:
- High-confidence outliers at low target lengths may indicate exceptional cases (e.g., students with strong prior knowledge).
- Low-confidence outliers at high target lengths suggest potential measurement errors or atypical scenarios.
### Interpretation
The plot demonstrates a weak but statistically significant positive relationship between target length and confidence in high school psychology contexts. The marginal histograms highlight that most observations cluster around moderate values (target length ~100, confidence ~0.5), suggesting a typical range for this dataset. The presence of outliers warrants further investigation to determine if they represent anomalies or meaningful subgroups (e.g., students with unique learning strategies). The shaded confidence interval around the trend line indicates uncertainty in the estimated relationship, emphasizing the need for larger sample sizes to strengthen conclusions. This visualization could inform educational strategies by identifying optimal target lengths for maximizing student confidence.