## Chart: Confidence vs. Target Length in High School Psychology
### Overview
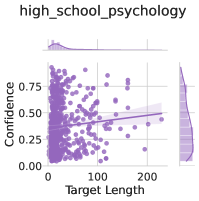
This image presents a scatter plot showing the relationship between "Target Length" and "Confidence" in the context of high school psychology. The plot includes a regression line with a confidence interval, as well as marginal density plots for each variable. The data points are clustered towards the lower end of the "Target Length" axis, with a slight upward trend in "Confidence" as "Target Length" increases.
### Components/Axes
* **Title:** high\_school\_psychology
* **X-axis:** Target Length (ranging from 0 to approximately 220)
* **Y-axis:** Confidence (ranging from 0.00 to 0.75)
* **Data Points:** Purple dots representing individual data points.
* **Regression Line:** A light purple line indicating the linear regression fit to the data.
* **Confidence Interval:** A shaded light purple area around the regression line, representing the confidence interval.
* **Marginal Density Plots:** Density plots along the top (for Target Length) and right side (for Confidence) showing the distribution of each variable.
### Detailed Analysis
* **Target Length Distribution:** The density plot along the top shows a high concentration of data points at lower "Target Length" values, with a long tail extending towards higher values.
* **Confidence Distribution:** The density plot on the right shows a distribution of "Confidence" values, with a peak around 0.00-0.25 and a tail extending towards higher values.
* **Scatter Plot:** The scatter plot shows a cluster of points at low "Target Length" values (0-50) with "Confidence" values ranging from 0.00 to 0.75. As "Target Length" increases, the "Confidence" values tend to increase slightly, as indicated by the regression line.
* **Regression Line:** The regression line has a positive slope, indicating a positive correlation between "Target Length" and "Confidence." The confidence interval widens as "Target Length" increases, suggesting greater uncertainty in the prediction of "Confidence" at higher "Target Length" values.
### Key Observations
* Most data points are concentrated at low "Target Length" values.
* There is a slight positive correlation between "Target Length" and "Confidence."
* The confidence interval widens as "Target Length" increases.
### Interpretation
The data suggests that, in the context of high school psychology, there is a weak positive relationship between the length of a target and the confidence associated with it. The concentration of data points at low "Target Length" values indicates that shorter targets are more common. The widening confidence interval at higher "Target Length" values suggests that the relationship between "Target Length" and "Confidence" becomes less predictable as "Target Length" increases. This could be due to various factors, such as the complexity of longer targets or the variability in individual responses.