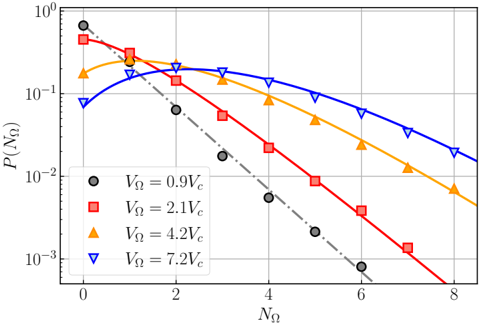
## Chart: Probability Distribution vs. N_Ω for Different V_Ω Values
### Overview
The image is a plot showing the probability distribution P(N_Ω) as a function of N_Ω for different values of V_Ω. The plot uses a logarithmic scale for the y-axis (P(N_Ω)) and a linear scale for the x-axis (N_Ω). There are four distinct data series, each representing a different value of V_Ω, and a dashed line.
### Components/Axes
* **X-axis:** N_Ω (linear scale, ranging from 0 to 8)
* **Y-axis:** P(N_Ω) (logarithmic scale, ranging from 10^-3 to 10^0)
* **Legend:** Located in the center-left of the plot.
* Black circles: V_Ω = 0.9V_c
* Red squares: V_Ω = 2.1V_c
* Orange triangles: V_Ω = 4.2V_c
* Blue inverted triangles: V_Ω = 7.2V_c
### Detailed Analysis
* **V_Ω = 0.9V_c (Black Circles):** The data points for this series show a decreasing trend as N_Ω increases.
* N_Ω = 0, P(N_Ω) ≈ 0.7
* N_Ω = 2, P(N_Ω) ≈ 0.07
* N_Ω = 4, P(N_Ω) ≈ 0.007
* **V_Ω = 2.1V_c (Red Squares):** The data points for this series show a decreasing trend as N_Ω increases.
* N_Ω = 0, P(N_Ω) ≈ 0.4
* N_Ω = 2, P(N_Ω) ≈ 0.15
* N_Ω = 4, P(N_Ω) ≈ 0.02
* N_Ω = 6, P(N_Ω) ≈ 0.003
* N_Ω = 8, P(N_Ω) ≈ 0.0001
* **V_Ω = 4.2V_c (Orange Triangles):** The data points for this series initially increase and then decrease as N_Ω increases.
* N_Ω = 0, P(N_Ω) ≈ 0.2
* N_Ω = 2, P(N_Ω) ≈ 0.15
* N_Ω = 4, P(N_Ω) ≈ 0.05
* N_Ω = 6, P(N_Ω) ≈ 0.01
* N_Ω = 8, P(N_Ω) ≈ 0.005
* **V_Ω = 7.2V_c (Blue Inverted Triangles):** The data points for this series initially increase and then decrease as N_Ω increases.
* N_Ω = 0, P(N_Ω) ≈ 0.07
* N_Ω = 2, P(N_Ω) ≈ 0.2
* N_Ω = 4, P(N_Ω) ≈ 0.15
* N_Ω = 6, P(N_Ω) ≈ 0.05
* N_Ω = 8, P(N_Ω) ≈ 0.02
* **Dashed Line (Gray):** This line shows a decreasing trend as N_Ω increases.
* N_Ω = 2, P(N_Ω) ≈ 0.1
* N_Ω = 6, P(N_Ω) ≈ 0.001
### Key Observations
* As V_Ω increases, the probability distribution P(N_Ω) shifts towards higher values of N_Ω.
* For lower values of V_Ω (0.9V_c and 2.1V_c), the probability distribution decreases monotonically with increasing N_Ω.
* For higher values of V_Ω (4.2V_c and 7.2V_c), the probability distribution initially increases and then decreases with increasing N_Ω.
* The dashed line has a steeper negative slope than the other lines.
### Interpretation
The plot illustrates how the probability distribution of N_Ω changes with varying values of V_Ω. The shift towards higher N_Ω values as V_Ω increases suggests that larger values of V_Ω favor higher occupancy states. The non-monotonic behavior of the probability distribution for higher V_Ω values indicates a more complex relationship between V_Ω and N_Ω, possibly due to the emergence of multiple occupancy states. The dashed line may represent a theoretical prediction or a reference point for comparison.