## Line Chart: Probability Distribution $P(N_\Omega)$ vs $N_\Omega$
### Overview
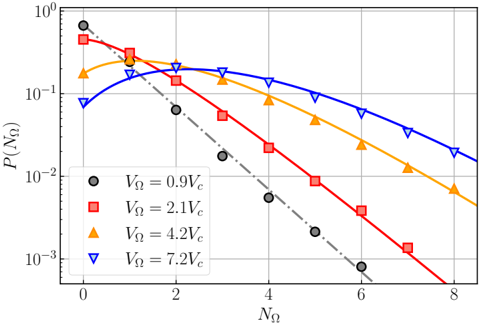
This image displays a semi-logarithmic line chart illustrating the probability distribution $P(N_\Omega)$ as a function of $N_\Omega$ for four different parameter values of $V_\Omega$ (relative to a critical value $V_c$). The chart demonstrates how increasing the parameter $V_\Omega$ shifts the probability distribution toward higher values of $N_\Omega$.
### Components/Axes
* **Y-Axis:** Represents $P(N_\Omega)$ on a logarithmic scale, ranging from $10^{-3}$ to $10^0$.
* **X-Axis:** Represents $N_\Omega$ on a linear scale, ranging from 0 to 8.
* **Legend:** Positioned in the bottom-left quadrant of the chart area.
* **Grey Circle:** $V_\Omega = 0.9V_c$
* **Red Square:** $V_\Omega = 2.1V_c$
* **Orange Triangle (Upward):** $V_\Omega = 4.2V_c$
* **Blue Triangle (Downward):** $V_\Omega = 7.2V_c$
* **Grid:** A light grey grid is overlaid on the chart to assist with reading values.
### Detailed Analysis
The chart plots four distinct data series, each represented by a specific symbol and a fitted curve.
**1. Grey Series ($V_\Omega = 0.9V_c$):**
* **Trend:** This series exhibits the steepest downward slope, starting at the highest probability at $N_\Omega=0$ and decaying rapidly.
* **Data Points:**
* $N_\Omega=0$: $\approx 0.7$
* $N_\Omega=1$: $\approx 0.25$
* $N_\Omega=2$: $\approx 0.06$
* $N_\Omega=3$: $\approx 0.018$
* $N_\Omega=4$: $\approx 0.005$
* $N_\Omega=6$: $\approx 0.0008$
**2. Red Series ($V_\Omega = 2.1V_c$):**
* **Trend:** Starts lower than the grey series at $N_\Omega=0$, but decays less steeply. It crosses the grey line at approximately $N_\Omega \approx 1.1$.
* **Data Points:**
* $N_\Omega=0$: $\approx 0.45$
* $N_\Omega=1$: $\approx 0.3$
* $N_\Omega=2$: $\approx 0.15$
* $N_\Omega=3$: $\approx 0.05$
* $N_\Omega=4$: $\approx 0.02$
* $N_\Omega=5$: $\approx 0.009$
* $N_\Omega=6$: $\approx 0.004$
* $N_\Omega=7$: $\approx 0.0015$
**3. Orange Series ($V_\Omega = 4.2V_c$):**
* **Trend:** This series shows a distinct peak around $N_\Omega=1$. It decays more slowly than the red series.
* **Data Points:**
* $N_\Omega=0$: $\approx 0.18$
* $N_\Omega=1$: $\approx 0.25$
* $N_\Omega=2$: $\approx 0.2$
* $N_\Omega=3$: $\approx 0.15$
* $N_\Omega=4$: $\approx 0.08$
* $N_\Omega=5$: $\approx 0.05$
* $N_\Omega=6$: $\approx 0.025$
* $N_\Omega=7$: $\approx 0.012$
* $N_\Omega=8$: $\approx 0.007$
**4. Blue Series ($V_\Omega = 7.2V_c$):**
* **Trend:** This series has the lowest starting probability at $N_\Omega=0$ but the slowest decay rate, resulting in the highest probability values at higher $N_\Omega$ (e.g., $N_\Omega > 2$). The peak is shifted further right, around $N_\Omega=2$.
* **Data Points:**
* $N_\Omega=0$: $\approx 0.08$
* $N_\Omega=1$: $\approx 0.18$
* $N_\Omega=2$: $\approx 0.22$
* $N_\Omega=3$: $\approx 0.2$
* $N_\Omega=4$: $\approx 0.15$
* $N_\Omega=5$: $\approx 0.1$
* $N_\Omega=6$: $\approx 0.06$
* $N_\Omega=7$: $\approx 0.035$
* $N_\Omega=8$: $\approx 0.02$
### Key Observations
* **Crossover Effect:** There is a clear "crossover" phenomenon. At low $N_\Omega$ values, lower $V_\Omega$ parameters yield higher probabilities. As $N_\Omega$ increases, the curves for higher $V_\Omega$ parameters overtake the lower ones.
* **Peak Shifting:** The mode (peak) of the distribution shifts to the right as $V_\Omega$ increases.
* $0.9V_c$: Peak at 0.
* $2.1V_c$: Peak at $\approx 1$.
* $4.2V_c$: Peak at $\approx 1$.
* $7.2V_c$: Peak at $\approx 2$.
### Interpretation
This chart represents a discrete probability distribution, likely a Poisson distribution or a similar counting process, where $V_\Omega$ acts as a scaling parameter (often related to the mean, $\lambda$).
The data demonstrates that as the parameter $V_\Omega$ increases, the distribution becomes broader and the expected value (mean) of $N_\Omega$ increases. This is a classic visualization of how a system's state distribution changes as an external driving force or energy parameter ($V_\Omega$) is increased. The system transitions from being highly likely to be in a low-count state (near 0) to being more likely to occupy higher-count states as the parameter $V_\Omega$ grows.