## Log-Log Plot: Probability P(N_Ω) vs. N_Ω for Different V_Ω Values
### Overview
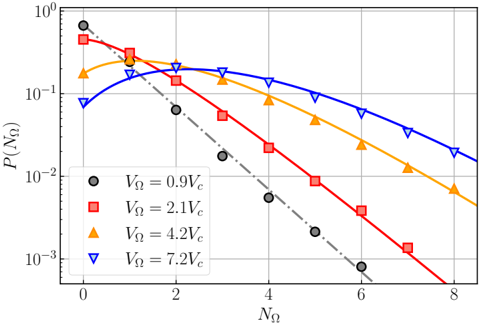
The image is a log-log plot showing the relationship between probability \( P(N_\Omega) \) (y-axis) and \( N_\Omega \) (x-axis) for four distinct values of \( V_\Omega \). The data is represented by four distinct symbols and colors, with a dashed reference line. The plot demonstrates how \( P(N_\Omega) \) decreases as \( N_\Omega \) increases, with varying trends depending on \( V_\Omega \).
---
### Components/Axes
- **X-axis (N_Ω)**: Labeled \( N_\Omega \), ranging from 0 to 8 in integer increments. Logarithmic scale.
- **Y-axis (P(N_Ω))**: Labeled \( P(N_\Omega) \), ranging from \( 10^{-3} \) to \( 10^0 \). Logarithmic scale.
- **Legend**: Located in the top-left corner, mapping symbols/colors to \( V_\Omega \) values:
- **Black circles**: \( V_\Omega = 0.9V_c \)
- **Red squares**: \( V_\Omega = 2.1V_c \)
- **Orange triangles**: \( V_\Omega = 4.2V_c \)
- **Blue inverted triangles**: \( V_\Omega = 7.2V_c \)
- **Dashed reference line**: Diagonal line from top-left to bottom-right, likely representing a theoretical prediction or baseline.
---
### Detailed Analysis
1. **Black Circles (\( V_\Omega = 0.9V_c \))**:
- Starts at \( P(N_\Omega) \approx 10^{-1} \) when \( N_\Omega = 0 \).
- Declines steeply, crossing the red squares (\( V_\Omega = 2.1V_c \)) near \( N_\Omega = 2 \).
- Ends at \( P(N_\Omega) \approx 10^{-3} \) for \( N_\Omega = 8 \).
2. **Red Squares (\( V_\Omega = 2.1V_c \))**:
- Begins at \( P(N_\Omega) \approx 10^{-1} \) for \( N_\Omega = 0 \).
- Declines gradually, intersecting the black circles at \( N_\Omega \approx 2 \).
- Reaches \( P(N_\Omega) \approx 10^{-3} \) at \( N_\Omega = 8 \).
3. **Orange Triangles (\( V_\Omega = 4.2V_c \))**:
- Starts at \( P(N_\Omega) \approx 10^{-1} \) for \( N_\Omega = 0 \).
- Declines more gradually than red squares, ending at \( P(N_\Omega) \approx 10^{-3} \) for \( N_\Omega = 8 \).
4. **Blue Inverted Triangles (\( V_\Omega = 7.2V_c \))**:
- Begins at \( P(N_\Omega) \approx 10^{-1} \) for \( N_\Omega = 0 \).
- Declines the slowest among all series, ending at \( P(N_\Omega) \approx 10^{-3} \) for \( N_\Omega = 8 \).
5. **Dashed Reference Line**:
- Follows a steep negative slope, suggesting a theoretical \( P(N_\Omega) \propto N_\Omega^{-k} \) relationship.
- All data series lie above this line, indicating deviations from the predicted trend.
---
### Key Observations
- **Universal Decline**: All \( V_\Omega \) values show a decreasing trend of \( P(N_\Omega) \) with increasing \( N_\Omega \).
- **Crossover Point**: The black circles (\( V_\Omega = 0.9V_c \)) and red squares (\( V_\Omega = 2.1V_c \)) intersect near \( N_\Omega = 2 \), suggesting a threshold effect.
- **Divergence from Theory**: The dashed line’s steep slope contrasts with the gradual decline of the data series, implying the model underestimates \( P(N_\Omega) \) at higher \( N_\Omega \).
- **V_Ω Dependency**: Higher \( V_\Omega \) values (e.g., \( 7.2V_c \)) exhibit slower decay in \( P(N_\Omega) \), indicating stronger resilience or stability.
---
### Interpretation
The plot demonstrates that \( P(N_\Omega) \) decreases with increasing \( N_\Omega \), but the rate of decay depends critically on \( V_\Omega \). Higher \( V_\Omega \) values (e.g., \( 7.2V_c \)) maintain higher probabilities at larger \( N_\Omega \), suggesting they represent more robust or stable configurations. The crossover between \( V_\Omega = 0.9V_c \) and \( 2.1V_c \) implies a critical threshold where system behavior shifts. The dashed reference line’s divergence highlights a discrepancy between the observed data and the theoretical model, potentially pointing to unaccounted variables (e.g., noise, external perturbations) or nonlinear effects in the system. This analysis could inform optimization strategies for systems governed by \( V_\Omega \)-dependent probabilities.