# Technical Document Extraction: Line Graph Analysis
## 1. Axis Labels and Titles
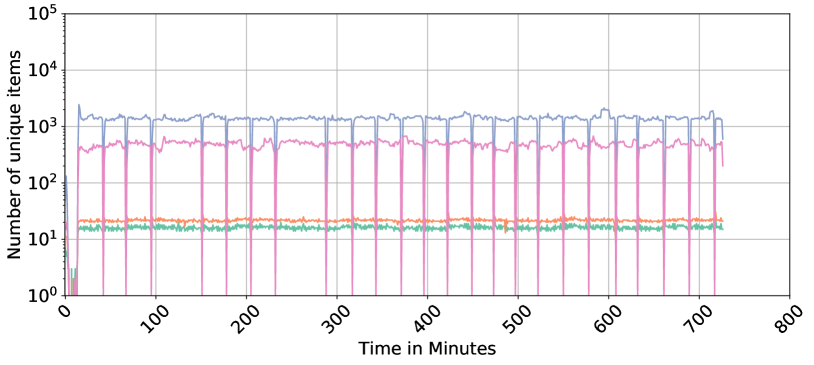
- **Y-Axis**: Labeled "Number of unique items" with a logarithmic scale ranging from \(10^0\) to \(10^5\).
- **X-Axis**: Labeled "Time in Minutes" with a linear scale from 0 to 800.
## 2. Legend and Data Series
- **Legend**: Located on the right side of the graph. Colors correspond to data series as follows:
- **Blue**: Highest data series (range: ~1,000–10,000 unique items).
- **Pink**: Second-highest (range: ~100–1,000 unique items).
- **Orange**: Third (range: ~10–100 unique items).
- **Green**: Lowest (range: ~1–10 unique items).
## 3. Data Trends
- **Blue Line**:
- **Trend**: Stable with minor fluctuations. Peaks consistently near \(10^3\) (1,000) unique items.
- **Key Points**:
- Initial spike at \(x=0\) (~1,000 items).
- Sustained oscillations between ~1,000–10,000 items.
- **Pink Line**:
- **Trend**: Moderate fluctuations. Peaks near \(10^2\) (100) unique items.
- **Key Points**:
- Initial value ~100 items.
- Oscillates between ~100–1,000 items.
- **Orange Line**:
- **Trend**: Stable with minor variations. Peaks near \(10^1\) (10) unique items.
- **Key Points**:
- Initial value ~10 items.
- Remains between ~10–100 items.
- **Green Line**:
- **Trend**: Minimal fluctuations. Peaks near \(10^0\) (1) unique item.
- **Key Points**:
- Initial value ~1 item.
- Remains between ~1–10 items.
## 4. Graph Components
- **Grid**: Light gray grid lines for reference.
- **Logarithmic Scale**: Y-axis uses powers of 10 (1, 10, 100, 1,000, 10,000, 100,000).
- **No Additional Text**: No embedded text, tables, or secondary legends.
## 5. Spatial Grounding
- **Legend Position**: Right-aligned, adjacent to the graph.
- **Color Consistency**:
- Blue line matches blue legend marker.
- Pink line matches pink legend marker.
- Orange line matches orange legend marker.
- Green line matches green legend marker.
## 6. Observations
- All data series exhibit periodic oscillations, suggesting cyclical behavior.
- Higher data series (blue, pink) show larger amplitude fluctuations compared to lower series (orange, green).
- No data points fall below \(10^0\) (1) or exceed \(10^5\) (100,000) on the y-axis.
## 7. Conclusion
The graph depicts four distinct data series with logarithmic scaling on the y-axis. Each series demonstrates unique amplitude and stability characteristics, with no overlapping trends or anomalies.