## Diagram: Cell Confinement and Traction Distribution
### Overview
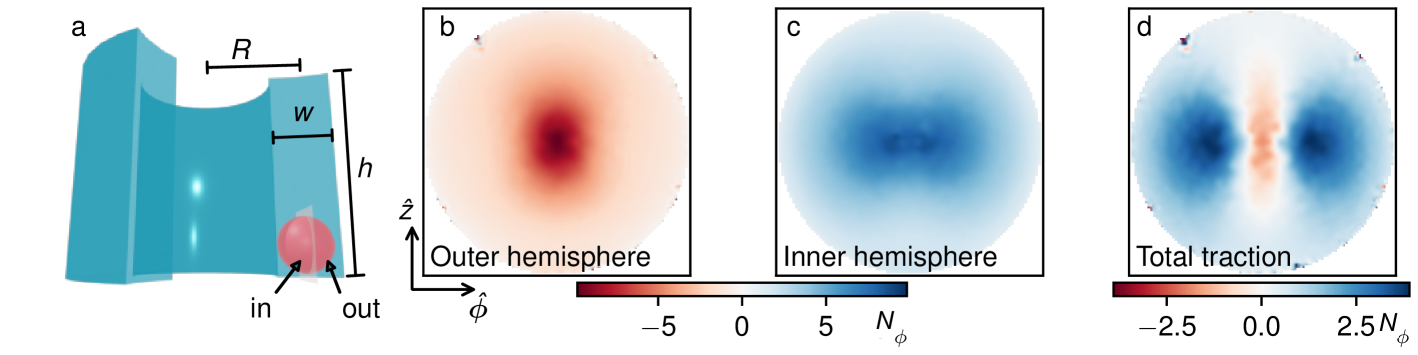
The image presents a schematic of a cell confined within a microchannel, along with heatmaps illustrating the traction distribution on the outer and inner hemispheres of the cell, and the total traction.
### Components/Axes
* **Panel a:** Schematic diagram of a cell within a microchannel.
* The microchannel is represented in blue.
* A red sphere represents the cell.
* Labels:
* "R": Indicates the radius of the microchannel.
* "w": Indicates the width of the microchannel.
* "h": Indicates the height of the microchannel.
* "in": Indicates the "in" side of the cell.
* "out": Indicates the "out" side of the cell.
* **Panel b:** Heatmap of traction distribution on the outer hemisphere of the cell.
* Label: "Outer hemisphere"
* Color scale: Red indicates negative values, blue indicates positive values.
* Axes:
* Horizontal axis: $\hat{\phi}$
* Vertical axis: $\hat{z}$
* Colorbar: Ranges from -5 to 5, labeled as $N_{\phi}$.
* **Panel c:** Heatmap of traction distribution on the inner hemisphere of the cell.
* Label: "Inner hemisphere"
* Color scale: Red indicates negative values, blue indicates positive values.
* Axes:
* Horizontal axis: $\hat{\phi}$
* Vertical axis: $\hat{z}$
* Colorbar: Ranges from -5 to 5, labeled as $N_{\phi}$.
* **Panel d:** Heatmap of total traction distribution on the cell.
* Label: "Total traction"
* Color scale: Red indicates negative values, blue indicates positive values.
* Axes:
* Horizontal axis: $\hat{\phi}$
* Vertical axis: $\hat{z}$
* Colorbar: Ranges from -2.5 to 2.5, labeled as $N_{\phi}$.
### Detailed Analysis
* **Panel a:** The cell is positioned within the microchannel, with the "in" side facing the entrance and the "out" side facing the exit. The dimensions R, w, and h are indicated.
* **Panel b:** The heatmap shows a concentration of negative traction (red) at the center of the outer hemisphere. The traction gradually decreases towards the edges.
* **Panel c:** The heatmap shows a concentration of positive traction (blue) at the center of the inner hemisphere. The traction gradually decreases towards the edges.
* **Panel d:** The heatmap shows a distribution of both positive and negative traction. There are two distinct regions of positive traction (blue) on either side of a central region of negative traction (red).
### Key Observations
* The outer hemisphere exhibits primarily negative traction, concentrated at the center.
* The inner hemisphere exhibits primarily positive traction, concentrated at the center.
* The total traction distribution shows a bipolar pattern with positive traction on the sides and negative traction in the center.
### Interpretation
The image illustrates the traction forces exerted by a cell confined within a microchannel. The outer hemisphere experiences compressive forces (negative traction), while the inner hemisphere experiences tensile forces (positive traction). The total traction distribution suggests that the cell is pulling inward from the sides and pushing outward from the center. This distribution of forces likely reflects the cell's attempt to adhere to the microchannel walls and maintain its position. The difference in colorbar scales between the outer/inner hemispheres and the total traction suggests that the magnitude of traction on the individual hemispheres is larger than the net traction.