\n
## Diagram: Cell Migration and Traction Forces
### Overview
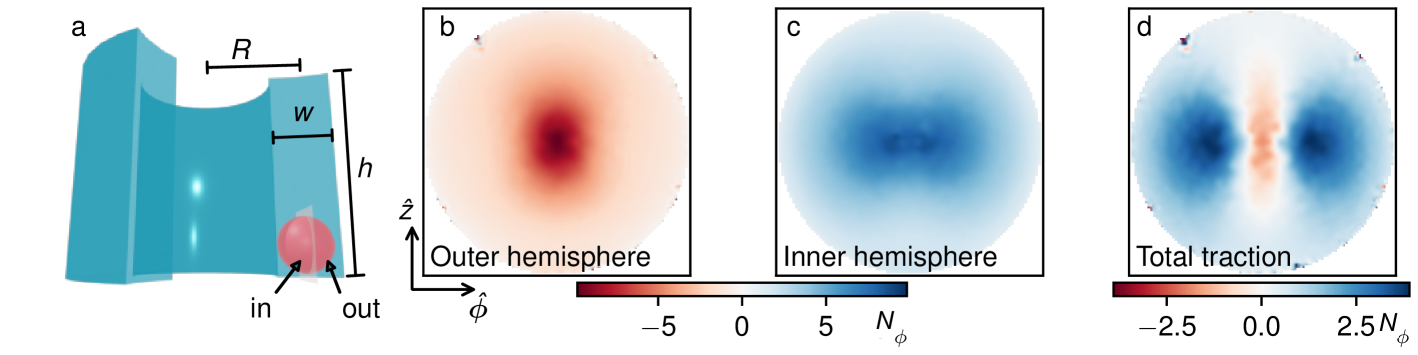
This diagram illustrates a cell interacting with a substrate, and the distribution of traction forces generated by the cell. It consists of a schematic representation of the cell and its environment (a), and three visualizations of traction force distributions (b, c, d). The visualizations appear to be heatmaps representing the magnitude and direction of traction forces.
### Components/Axes
* **(a) Schematic:** Shows a cell (light blue) interacting with a substrate. Labels indicate:
* `R`: Horizontal distance, approximately 10-15 units.
* `w`: Vertical distance, approximately 5-7 units.
* `h`: Vertical distance, approximately 10-12 units.
* `in`: Arrow indicating fluid/material entering the cell.
* `out`: Arrow indicating fluid/material exiting the cell.
* **(b) Outer hemisphere:** Heatmap labeled "Outer hemisphere". Axes:
* `ẑ`: Vertical axis.
* `φ`: Horizontal axis.
* Color scale: Ranges from -5 to 5, labeled `Nφ`.
* **(c) Inner hemisphere:** Heatmap labeled "Inner hemisphere". Axes:
* `ẑ`: Vertical axis.
* `φ`: Horizontal axis.
* Color scale: Ranges from -5 to 5, labeled `Nφ`.
* **(d) Total traction:** Heatmap labeled "Total traction". Axes:
* `ẑ`: Vertical axis.
* `φ`: Horizontal axis.
* Color scale: Ranges from -2.5 to 2.5, labeled `Nφ`.
### Detailed Analysis or Content Details
* **(a) Schematic:** The cell is depicted as a roughly rectangular shape with a curved underside. The dimensions `R`, `w`, and `h` provide a scale for the cell's size. The "in" and "out" arrows suggest a flow of material or fluid across the cell membrane.
* **(b) Outer hemisphere:** The heatmap shows a strong red region (positive `Nφ` values) at the center, surrounded by blue regions (negative `Nφ` values). The intensity of the red is highest at the center, decreasing radially outwards. The distribution appears roughly circular.
* **(c) Inner hemisphere:** The heatmap shows a more diffuse distribution of traction forces. There is a central region of moderate intensity, with less pronounced red and blue areas compared to the outer hemisphere. The distribution is also roughly circular.
* **(d) Total traction:** This heatmap displays two distinct, elongated regions of positive traction force (red) flanking a central region of negative traction force (blue). The red regions are more intense than the blue region. The overall shape is bilaterally symmetric.
### Key Observations
* The traction forces are not uniformly distributed.
* The outer hemisphere exhibits a more concentrated traction force distribution than the inner hemisphere.
* The total traction force distribution shows a clear pattern of opposing forces, suggesting a mechanism for cell movement or deformation.
* The color scales indicate that the magnitude of traction forces in the outer and inner hemispheres is generally higher than the total traction.
### Interpretation
This diagram likely represents a model or experimental data related to cell migration and the forces a cell exerts on its surrounding environment. The schematic (a) provides context for the traction force visualizations. The heatmaps (b, c, d) show the spatial distribution of these forces.
The outer hemisphere (b) likely represents the traction forces at the leading edge of the cell, where the cell is actively adhering to and pulling on the substrate. The inner hemisphere (c) may represent the traction forces within the cell body, which are less concentrated. The total traction (d) shows the net effect of these forces, resulting in a pattern consistent with cell polarization and directional movement. The opposing forces suggest that the cell is generating tension to propel itself forward.
The difference in color scale ranges between the hemisphere maps and the total traction map suggests that the total traction is a summation of the forces, and therefore has a lower overall magnitude. The bilaterally symmetric pattern in the total traction map indicates that the cell is exerting force in two opposing directions, which is consistent with the process of cell elongation and migration.