## Diagram: Stress Distribution in Hemispherical Geometry
### Overview
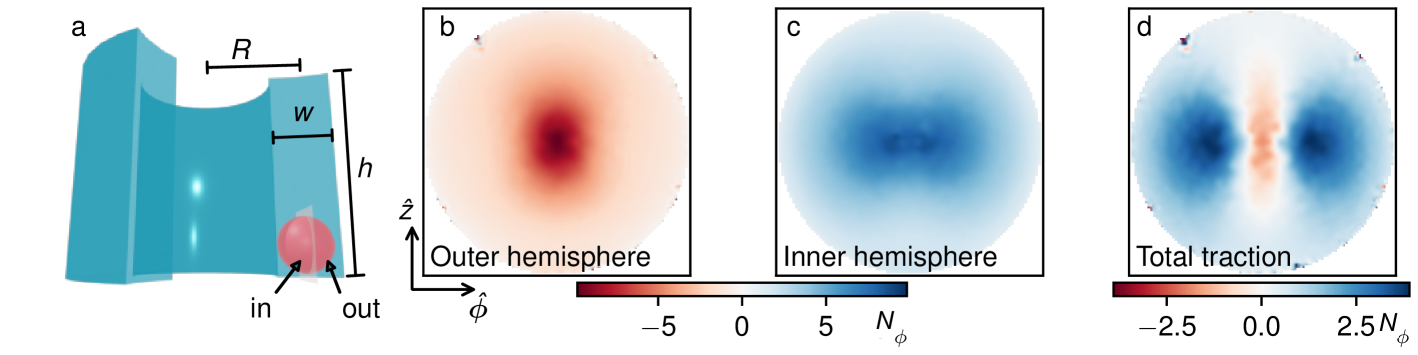
The image presents a technical diagram of a hemispherical geometry with a ball interacting with its surface, accompanied by three heatmaps visualizing stress distribution. Diagram (a) illustrates the physical setup, while (b)-(d) show quantitative stress maps with color-coded scales.
### Components/Axes
**Diagram (a):**
- **Geometry**: Cylindrical container with:
- Radius **R** (horizontal dimension)
- Height **h** (vertical dimension)
- Width **w** (depth dimension)
- **Key elements**:
- Ball labeled **in** (incoming) and **out** (outgoing)
- Coordinate system:
- **ẑ** (vertical axis)
- **φ** (azimuthal angle)
**Heatmaps (b)-(d):**
- **Axes**:
- **φ** (horizontal axis, 0° to 360°)
- **ẑ** (vertical axis, -h/2 to h/2)
- **Color scales**:
- **b (Outer hemisphere)**: -5 to +5 (N_φ)
- **c (Inner hemisphere)**: -2.5 to +2.5 (N_φ)
- **d (Total traction)**: -2.5 to +2.5 (N_φ)
### Detailed Analysis
**Diagram (a):**
- Ball positioned at the bottom-right corner of the container
- Dimensions labeled with approximate values (R, w, h) but no numerical scale provided
**Heatmap (b) - Outer Hemisphere:**
- **Color distribution**:
- Dark red center (φ=0°, ẑ=0)
- Gradual transition to blue at φ=180°
- Symmetric pattern around ẑ=0
- **Key values**:
- Maximum stress: ~+5 N_φ (center)
- Minimum stress: ~-5 N_φ (φ=180°)
**Heatmap (c) - Inner Hemisphere:**
- **Color distribution**:
- Dark blue center (φ=0°, ẑ=0)
- Gradual transition to light blue at φ=180°
- Symmetric pattern around ẑ=0
- **Key values**:
- Maximum stress: ~-2.5 N_φ (center)
- Minimum stress: ~+2.5 N_φ (φ=180°)
**Heatmap (d) - Total Traction:**
- **Color distribution**:
- Central orange stripe (φ=0°)
- Blue regions at φ=90° and φ=270°
- Symmetric pattern around ẑ=0
- **Key values**:
- Maximum positive stress: ~+2.5 N_φ (φ=0°)
- Maximum negative stress: ~-2.5 N_φ (φ=180°)
### Key Observations
1. **Stress Cancellation**: Total traction (d) shows opposing stress regions canceling each other, creating a neutral zone at φ=90°/270°
2. **Hemispherical Symmetry**: All maps exhibit perfect φ-symmetry
3. **Scale Consistency**: Color scales use identical N_φ units across all heatmaps
4. **Stress Magnitude**: Outer hemisphere experiences twice the stress magnitude of inner hemisphere
### Interpretation
The data suggests a mechanical interaction between the ball and hemispherical surfaces, likely modeling:
- **Contact mechanics**: Stress concentration at the point of contact (φ=0°)
- **Force distribution**: Outer hemisphere bears compressive stresses (+N_φ), while inner hemisphere experiences tensile stresses (-N_φ)
- **Equilibrium state**: Total traction map (d) indicates balanced forces with minimal net stress at φ=90°/270°
The hemispherical geometry's curvature creates stress concentration at the contact point, with the inner surface experiencing opposite stress polarity due to material deformation. The total traction map reveals how these opposing stresses partially cancel, leaving residual stress patterns that could inform material failure analysis or contact mechanics studies.