## Histogram: Distribution Plot
### Overview
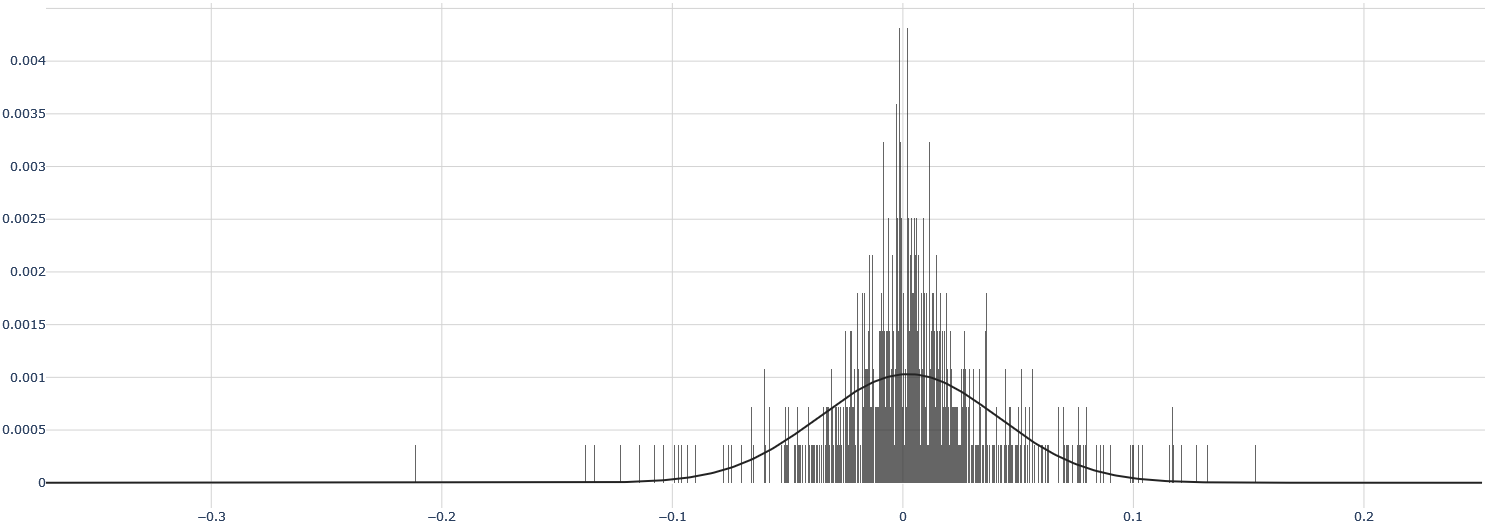
The image is a histogram overlaid with a probability density function (PDF). The histogram consists of vertical bars representing the frequency distribution of data, while the PDF is a smooth curve that approximates the distribution. The data appears to be centered around zero.
### Components/Axes
* **X-axis:** Ranges from approximately -0.3 to 0.25, with tick marks at -0.3, -0.2, -0.1, 0, 0.1, and 0.2.
* **Y-axis:** Ranges from 0 to 0.004, with tick marks at 0, 0.0005, 0.001, 0.0015, 0.002, 0.0025, 0.003, 0.0035, and 0.004.
* **Histogram:** The histogram is represented by gray vertical bars. The height of each bar indicates the frequency of data points within that bin.
* **PDF:** A black curve is overlaid on the histogram, representing the probability density function. It approximates the shape of the histogram.
### Detailed Analysis
* **Histogram:** The histogram shows a high concentration of data points around zero. The frequency decreases as you move away from zero in either direction. The bars are densest and tallest near zero, indicating a high frequency of values close to zero.
* **PDF:** The PDF curve is centered around zero and has a bell-like shape, suggesting a normal distribution. The peak of the curve is at zero, corresponding to the highest frequency in the histogram. The curve tapers off symmetrically on both sides.
### Key Observations
* The data is heavily concentrated around zero.
* The distribution appears to be approximately normal.
* There are fewer data points in the tails of the distribution (i.e., far from zero).
### Interpretation
The histogram and PDF suggest that the data is normally distributed with a mean close to zero. The high concentration of data points around zero indicates that values close to zero are much more common than values far from zero. This type of distribution is often seen in situations where values are expected to cluster around a central value, such as measurement errors or random fluctuations around an average. The symmetry of the distribution suggests that positive and negative deviations from zero are equally likely.