## Histogram with Normal Distribution Overlay: Value Frequency Distribution
### Overview
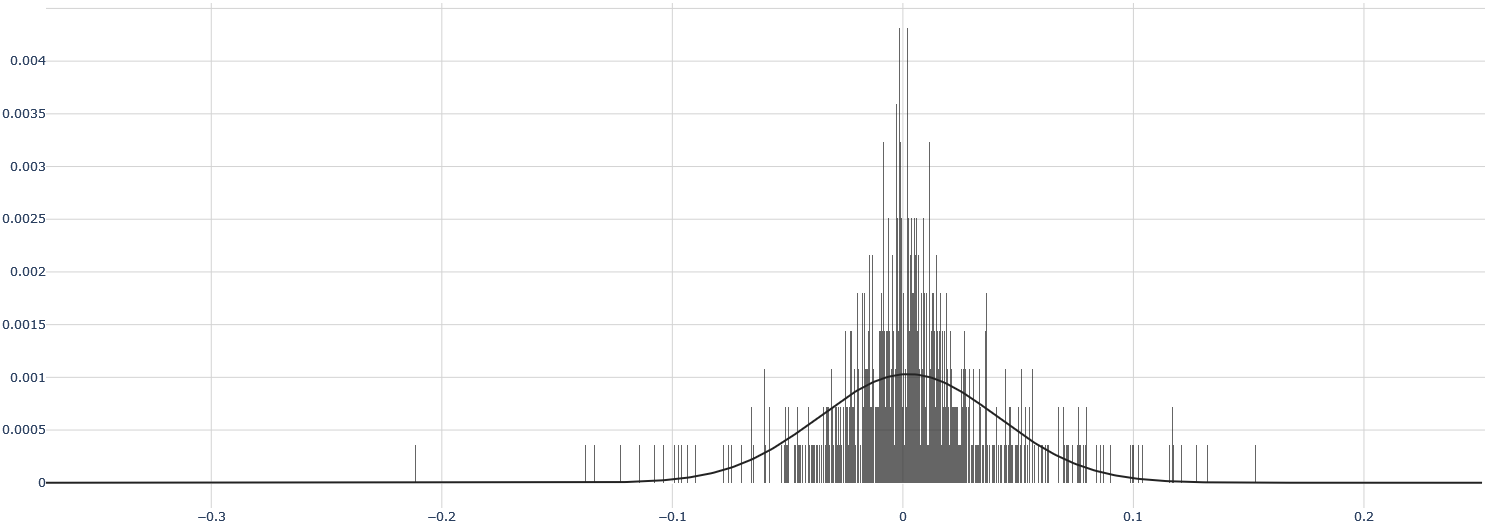
The image displays a histogram overlaid with a normal distribution curve. The histogram shows the frequency distribution of data points across a range of values, while the curve represents the theoretical normal distribution that fits the data. The x-axis spans from -0.3 to 0.2, and the y-axis measures frequency up to 0.004.
### Components/Axes
- **X-axis (Value)**: Labeled "Value," with tick marks at -0.3, -0.25, -0.2, -0.15, -0.1, 0, 0.05, 0.1, and 0.15. The scale increments by 0.05.
- **Y-axis (Frequency)**: Labeled "Frequency," with tick marks at 0.0005, 0.001, 0.0015, 0.002, 0.0025, 0.003, 0.0035, and 0.004. The scale increments by 0.0005.
- **Legend**: Located at the bottom-right corner, with two entries:
- **Normal Distribution Curve**: Black line.
- **Histogram Bars**: Gray bars.
### Detailed Analysis
1. **Histogram Bars**:
- The tallest bar is centered at **0**, with a frequency of approximately **0.0035**.
- Bars decrease symmetrically as they move away from 0:
- At **-0.1** and **0.1**, frequency ≈ **0.0025**.
- At **-0.2** and **0.2**, frequency ≈ **0.0015**.
- At **-0.3** and **0.15**, frequency ≈ **0.0005**.
- Bars are evenly spaced at 0.05-unit intervals.
2. **Normal Distribution Curve**:
- Peaks at **0** with a frequency of **0.0035**, matching the histogram's tallest bar.
- The curve tapers off symmetrically toward the edges, closely following the histogram's shape.
- The curve's inflection points (where concavity changes) occur near **-0.1** and **0.1**, aligning with the histogram's steepest declines.
### Key Observations
- The data is **symmetric** around 0, consistent with a normal distribution.
- The histogram bars and curve align closely, suggesting the data fits a normal distribution well.
- The highest frequency occurs at **0**, with frequencies decreasing by ~0.001 per 0.05-unit step away from the center.
- The histogram shows slight asymmetry in the tails (e.g., the left tail extends slightly further to -0.3 than the right to 0.2), but the curve smooths this out.
### Interpretation
The data likely represents a process governed by a normal distribution, such as measurement errors, natural variations, or standardized test scores. The histogram and curve together confirm that:
- **Most data points cluster near the mean (0)**, with fewer extreme values.
- The distribution is approximately symmetric, though minor skewness may exist in the tails.
- The normal distribution curve provides a good fit, enabling probabilistic interpretations (e.g., ~68% of data lies within ±0.1 of the mean).
This visualization is critical for identifying outliers, validating assumptions of normality, and informing statistical analyses like confidence intervals or hypothesis testing.