TECHNICAL ASSET FINGERPRINT
f9ae8df1faf3bbf9218545b0
Click to view fullscreen
Press ESC or click to close
FOUND IN PAPERS
EXPERT: gemini-2.0-flash VERSION 1
RUNTIME: nugit/gemini/gemini-2.0-flash
INTEL_VERIFIED
## Chart: Performance Curves for Different Tasks
### Overview
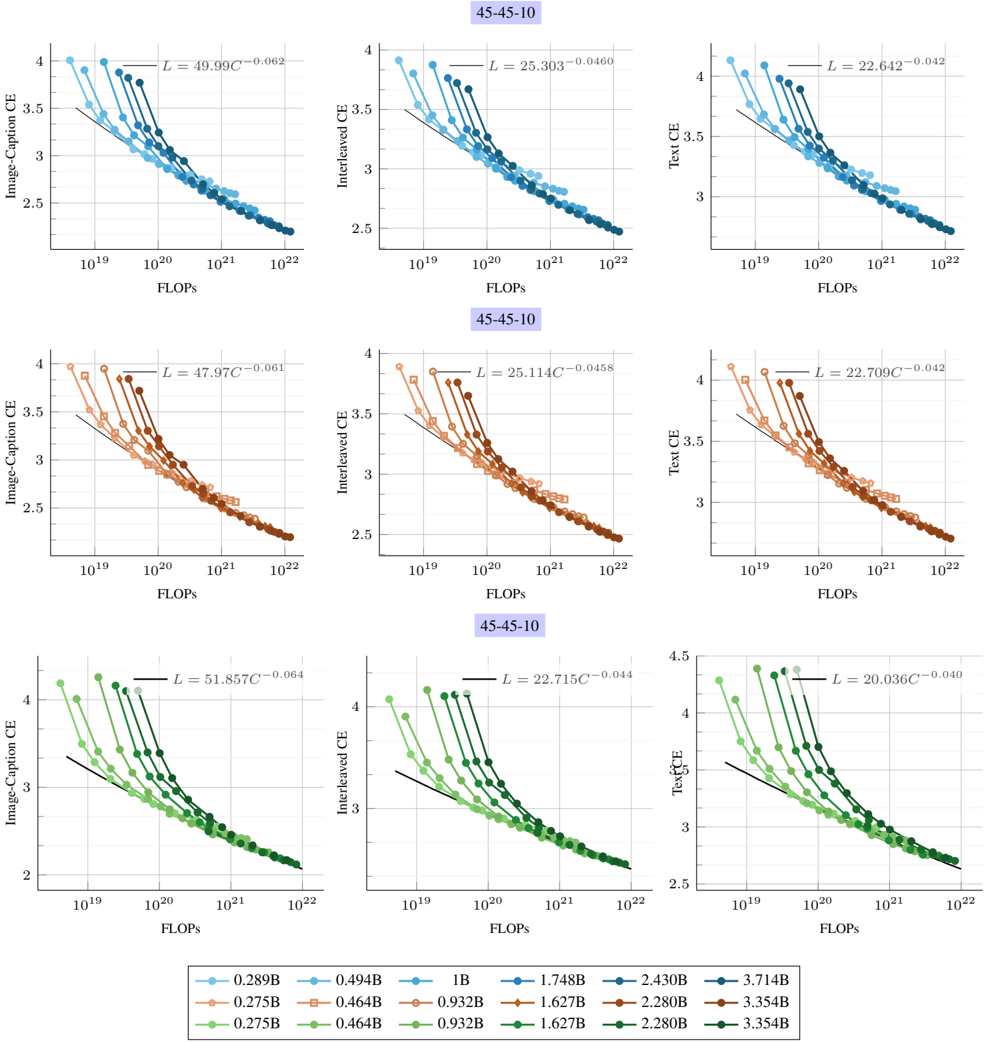
The image presents a series of performance curves, plotting the relationship between computational cost (FLOPS) and cross-entropy loss (CE) for different tasks: Image-Caption, Interleaved, and Text. Each plot shows multiple curves, each representing a different model size, ranging from 0.275B to 3.714B parameters. The plots are arranged in a 3x3 grid, with each row representing a different task and each column representing a different performance metric. The title "45-45-10" appears above the middle column of plots.
### Components/Axes
* **X-axis:** FLOPS (Floating Point Operations Per Second) on a logarithmic scale from 10^19 to 10^22.
* **Y-axis:** Cross-Entropy (CE) Loss. The range varies slightly between plots, but generally spans from approximately 2 to 4.5.
* **Titles:**
* Left Column: "Image-Caption CE"
* Middle Column: "Interleaved CE"
* Right Column: "Text CE"
* **Legend:** Located at the bottom of the image.
* `0.289B` (lightest shade in each color group)
* `0.494B` (second lightest shade in each color group)
* `1B` (third lightest shade in each color group)
* `1.748B` (middle shade in each color group)
* `2.430B` (second darkest shade in each color group)
* `3.714B` (darkest shade in each color group)
* `0.275B` (lightest shade in each color group)
* `0.464B` (second lightest shade in each color group)
* `0.932B` (third lightest shade in each color group)
* `1.627B` (middle shade in each color group)
* `2.280B` (second darkest shade in each color group)
* `3.354B` (darkest shade in each color group)
* **Regression Lines:** Each plot contains a black line representing a power-law fit to the data. The equation for each line is displayed on the plot in the form "L = a\*C^(-b)", where L is the loss, C is the compute (FLOPS), and a and b are constants.
* **Title:** The title "45-45-10" is present above the Interleaved CE plots.
### Detailed Analysis
**Row 1: Image-Caption CE, Interleaved CE, Text CE (Blue)**
* **Image-Caption CE:**
* Trend: The curves generally slope downwards, indicating decreasing loss with increasing FLOPS.
* Equation: L = 49.99\*C^(-0.062)
* Data Points: The curves are clustered, with the largest model (3.714B) achieving the lowest loss for a given FLOPS.
* **Interleaved CE:**
* Trend: The curves generally slope downwards, indicating decreasing loss with increasing FLOPS.
* Equation: L = 25.303\*C^(-0.0460)
* Data Points: The curves are clustered, with the largest model (3.714B) achieving the lowest loss for a given FLOPS.
* **Text CE:**
* Trend: The curves generally slope downwards, indicating decreasing loss with increasing FLOPS.
* Equation: L = 22.642\*C^(-0.042)
* Data Points: The curves are clustered, with the largest model (3.714B) achieving the lowest loss for a given FLOPS.
**Row 2: Image-Caption CE, Interleaved CE, Text CE (Brown)**
* **Image-Caption CE:**
* Trend: The curves generally slope downwards, indicating decreasing loss with increasing FLOPS.
* Equation: L = 47.97\*C^(-0.061)
* Data Points: The curves are clustered, with the largest model (3.354B) achieving the lowest loss for a given FLOPS.
* **Interleaved CE:**
* Trend: The curves generally slope downwards, indicating decreasing loss with increasing FLOPS.
* Equation: L = 25.114\*C^(-0.0458)
* Data Points: The curves are clustered, with the largest model (3.354B) achieving the lowest loss for a given FLOPS.
* **Text CE:**
* Trend: The curves generally slope downwards, indicating decreasing loss with increasing FLOPS.
* Equation: L = 22.709\*C^(-0.042)
* Data Points: The curves are clustered, with the largest model (3.354B) achieving the lowest loss for a given FLOPS.
**Row 3: Image-Caption CE, Interleaved CE, Text CE (Green)**
* **Image-Caption CE:**
* Trend: The curves generally slope downwards, indicating decreasing loss with increasing FLOPS.
* Equation: L = 51.857\*C^(-0.064)
* Data Points: The curves are clustered, with the largest model (3.354B) achieving the lowest loss for a given FLOPS.
* **Interleaved CE:**
* Trend: The curves generally slope downwards, indicating decreasing loss with increasing FLOPS.
* Equation: L = 22.715\*C^(-0.044)
* Data Points: The curves are clustered, with the largest model (3.354B) achieving the lowest loss for a given FLOPS.
* **Text CE:**
* Trend: The curves generally slope downwards, indicating decreasing loss with increasing FLOPS.
* Equation: L = 20.036\*C^(-0.040)
* Data Points: The curves are clustered, with the largest model (3.354B) achieving the lowest loss for a given FLOPS.
### Key Observations
* **Power-Law Relationship:** The relationship between FLOPS and CE loss appears to follow a power-law distribution, as indicated by the fitted lines.
* **Model Size Impact:** Larger models (higher number of parameters) generally achieve lower CE loss for a given number of FLOPS.
* **Task-Specific Performance:** The specific values of CE loss and the coefficients in the power-law equations vary depending on the task (Image-Caption, Interleaved, Text).
* **Color Grouping:** Each row has a distinct color scheme (blue, brown, green), but the significance of this grouping is not immediately apparent from the image alone.
### Interpretation
The data suggests that increasing the computational cost (FLOPS) during training leads to a reduction in cross-entropy loss for all three tasks (Image-Caption, Interleaved, and Text). Furthermore, larger models tend to perform better (lower loss) for a given amount of computation. The power-law relationship indicates diminishing returns, meaning that the reduction in loss becomes smaller as the amount of computation increases. The task-specific differences in performance suggest that some tasks are inherently easier to learn than others, or that the models are better suited to some tasks than others. The "45-45-10" title might refer to a specific experimental setup or configuration used to generate these results, but without further context, its meaning is unclear. The color grouping of the rows might represent different datasets, training regimes, or model architectures, but this requires additional information to confirm.
DECODING INTELLIGENCE...