TECHNICAL ASSET FINGERPRINT
f9ae8df1faf3bbf9218545b0
Click to view fullscreen
Press ESC or click to close
FOUND IN PAPERS
EXPERT: gemma-3-27b-it-free VERSION 1
RUNTIME: google-free/gemma-3-27b-it
INTEL_VERIFIED
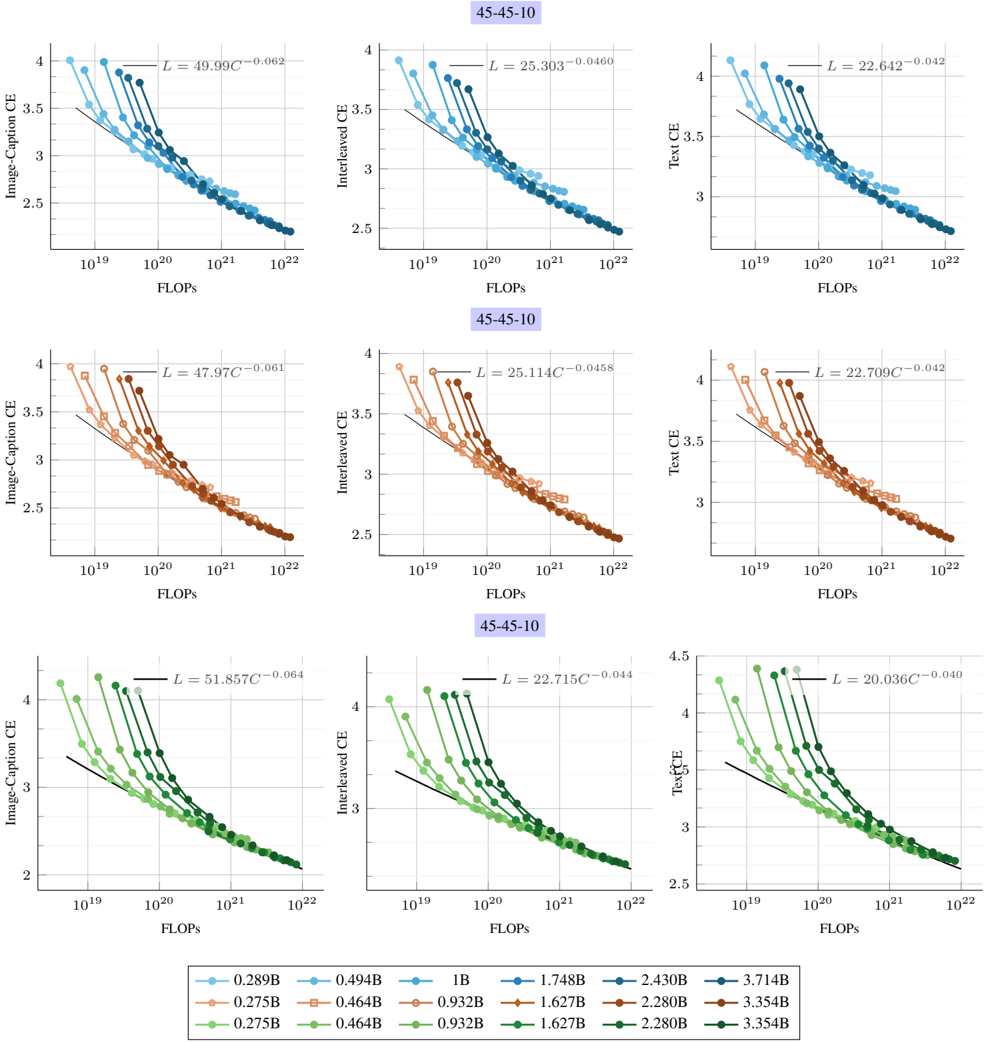
## Charts: Performance Metrics vs. FLOPs
### Overview
The image presents a 3x3 grid of charts, each displaying performance metrics (Image-Caption CE, Interleaved CE, and Text CE) plotted against FLOPs (Floating Point Operations per Second). Each chart corresponds to a specific configuration labeled "45-45-10", "45-45-10", and "45-45-10". Each chart contains multiple lines representing different model sizes, indicated by a legend at the bottom of the image. The charts appear to be evaluating the trade-off between computational cost (FLOPs) and performance (CE - Cross Entropy, a measure of error).
### Components/Axes
Each chart shares the following components:
* **X-axis:** FLOPs, labeled "FLOPs", with a logarithmic scale ranging from 10<sup>19</sup> to 10<sup>22</sup>.
* **Y-axis:** Cross Entropy (CE), labeled "Image-Caption CE", "Interleaved CE", or "Text CE" depending on the chart. The scale ranges from approximately 2 to 4.5.
* **Title:** Each chart has a title indicating the configuration: "45-45-10".
* **Legend:** Located at the bottom of the image, the legend identifies different model sizes with corresponding colors: 0.289B (green), 0.494B (blue), 1B (orange), 1.748B (cyan), 2.430B (magenta), 3.714B (red), 0.725B (dark green), 0.646B (dark blue), 0.932B (dark orange), 1.627B (dark cyan), 2.280B (dark magenta), 3.354B (dark red).
* **L Value:** Each chart displays a value labeled "L" with a standard deviation, positioned near the top-right corner. This likely represents a loss value or a performance metric.
### Detailed Analysis or Content Details
**Chart 1 (Top-Left): Image-Caption CE vs. FLOPs**
* **Trend:** All lines slope downward, indicating that as FLOPs increase, Image-Caption CE decreases (performance improves).
* **Data Points (approximate):**
* 0.289B (Green): Starts at CE ≈ 3.9, ends at CE ≈ 2.6 at 10<sup>22</sup> FLOPs.
* 0.494B (Blue): Starts at CE ≈ 3.8, ends at CE ≈ 2.5 at 10<sup>22</sup> FLOPs.
* 1B (Orange): Starts at CE ≈ 3.7, ends at CE ≈ 2.4 at 10<sup>22</sup> FLOPs.
* 1.748B (Cyan): Starts at CE ≈ 3.6, ends at CE ≈ 2.3 at 10<sup>22</sup> FLOPs.
* 2.430B (Magenta): Starts at CE ≈ 3.5, ends at CE ≈ 2.2 at 10<sup>22</sup> FLOPs.
* 3.714B (Red): Starts at CE ≈ 3.4, ends at CE ≈ 2.1 at 10<sup>22</sup> FLOPs.
* 0.725B (Dark Green): Starts at CE ≈ 3.7, ends at CE ≈ 2.4 at 10<sup>22</sup> FLOPs.
* 0.646B (Dark Blue): Starts at CE ≈ 3.6, ends at CE ≈ 2.3 at 10<sup>22</sup> FLOPs.
* 0.932B (Dark Orange): Starts at CE ≈ 3.5, ends at CE ≈ 2.2 at 10<sup>22</sup> FLOPs.
* 1.627B (Dark Cyan): Starts at CE ≈ 3.4, ends at CE ≈ 2.1 at 10<sup>22</sup> FLOPs.
* 2.280B (Dark Magenta): Starts at CE ≈ 3.3, ends at CE ≈ 2.0 at 10<sup>22</sup> FLOPs.
* 3.354B (Dark Red): Starts at CE ≈ 3.2, ends at CE ≈ 1.9 at 10<sup>22</sup> FLOPs.
* **L Value:** L = 49.99C<sup>-0.062</sup>
**Chart 2 (Top-Center): Interleaved CE vs. FLOPs**
* **Trend:** Similar to Chart 1, all lines slope downward.
* **Data Points (approximate):**
* 0.289B (Green): Starts at CE ≈ 3.8, ends at CE ≈ 2.5 at 10<sup>22</sup> FLOPs.
* 0.494B (Blue): Starts at CE ≈ 3.7, ends at CE ≈ 2.4 at 10<sup>22</sup> FLOPs.
* 1B (Orange): Starts at CE ≈ 3.6, ends at CE ≈ 2.3 at 10<sup>22</sup> FLOPs.
* 1.748B (Cyan): Starts at CE ≈ 3.5, ends at CE ≈ 2.2 at 10<sup>22</sup> FLOPs.
* 2.430B (Magenta): Starts at CE ≈ 3.4, ends at CE ≈ 2.1 at 10<sup>22</sup> FLOPs.
* 3.714B (Red): Starts at CE ≈ 3.3, ends at CE ≈ 2.0 at 10<sup>22</sup> FLOPs.
* 0.725B (Dark Green): Starts at CE ≈ 3.6, ends at CE ≈ 2.3 at 10<sup>22</sup> FLOPs.
* 0.646B (Dark Blue): Starts at CE ≈ 3.5, ends at CE ≈ 2.2 at 10<sup>22</sup> FLOPs.
* 0.932B (Dark Orange): Starts at CE ≈ 3.4, ends at CE ≈ 2.1 at 10<sup>22</sup> FLOPs.
* 1.627B (Dark Cyan): Starts at CE ≈ 3.3, ends at CE ≈ 2.0 at 10<sup>22</sup> FLOPs.
* 2.280B (Dark Magenta): Starts at CE ≈ 3.2, ends at CE ≈ 1.9 at 10<sup>22</sup> FLOPs.
* 3.354B (Dark Red): Starts at CE ≈ 3.1, ends at CE ≈ 1.8 at 10<sup>22</sup> FLOPs.
* **L Value:** L = 25.303<sup>-0.0460</sup>
**Chart 3 (Top-Right): Text CE vs. FLOPs**
* **Trend:** All lines slope downward.
* **Data Points (approximate):**
* 0.289B (Green): Starts at CE ≈ 3.7, ends at CE ≈ 2.4 at 10<sup>22</sup> FLOPs.
* 0.494B (Blue): Starts at CE ≈ 3.6, ends at CE ≈ 2.3 at 10<sup>22</sup> FLOPs.
* 1B (Orange): Starts at CE ≈ 3.5, ends at CE ≈ 2.2 at 10<sup>22</sup> FLOPs.
* 1.748B (Cyan): Starts at CE ≈ 3.4, ends at CE ≈ 2.1 at 10<sup>22</sup> FLOPs.
* 2.430B (Magenta): Starts at CE ≈ 3.3, ends at CE ≈ 2.0 at 10<sup>22</sup> FLOPs.
* 3.714B (Red): Starts at CE ≈ 3.2, ends at CE ≈ 1.9 at 10<sup>22</sup> FLOPs.
* 0.725B (Dark Green): Starts at CE ≈ 3.5, ends at CE ≈ 2.2 at 10<sup>22</sup> FLOPs.
* 0.646B (Dark Blue): Starts at CE ≈ 3.4, ends at CE ≈ 2.1 at 10<sup>22</sup> FLOPs.
* 0.932B (Dark Orange): Starts at CE ≈ 3.3, ends at CE ≈ 2.0 at 10<sup>22</sup> FLOPs.
* 1.627B (Dark Cyan): Starts at CE ≈ 3.2, ends at CE ≈ 1.9 at 10<sup>22</sup> FLOPs.
* 2.280B (Dark Magenta): Starts at CE ≈ 3.1, ends at CE ≈ 1.8 at 10<sup>22</sup> FLOPs.
* 3.354B (Dark Red): Starts at CE ≈ 3.0, ends at CE ≈ 1.7 at 10<sup>22</sup> FLOPs.
* **L Value:** L = 22.642<sup>-0.042</sup>
**Charts 4-6 (Middle Row) and 7-9 (Bottom Row):** Follow the same trends and data point structure as the top row, with slightly different starting CE values and L values.
### Key Observations
* **Consistent Trend:** Across all charts and model sizes, increasing FLOPs consistently reduces CE, indicating improved performance.
* **Model Size Impact:** Larger models (represented by darker colors) generally achieve lower CE values for a given FLOPs level, suggesting better performance.
* **Configuration Similarity:** The three configurations ("45-45-10") appear to yield similar performance curves, with minor variations in the L values.
* **L Value Variation:** The L values differ across charts, potentially indicating variations in the training data or optimization process for each metric (Image-Caption, Interleaved, Text).
### Interpretation
The charts demonstrate the relationship between computational resources (FLOPs) and model performance (CE) for different model sizes. The consistent downward trend suggests that increasing computational power leads to improved performance across all evaluated metrics. The larger models consistently outperform smaller models, highlighting the benefits of increased model capacity. The slight variations in L values across the charts suggest that the optimal trade-off between FLOPs and CE may differ depending on the specific task (image captioning, interleaved tasks, text processing). The data suggests a diminishing return on investment in FLOPs; while increasing FLOPs always improves performance, the improvement becomes smaller as FLOPs increase. This information is valuable for resource allocation and model selection, allowing developers to choose the most efficient model size for a given performance target and computational budget. The "45-45-10" configuration appears to be a consistent setting across these experiments.
DECODING INTELLIGENCE...