\n
## Line Chart: Validation Score vs. Training Step (Benchmark: AMC23)
### Overview
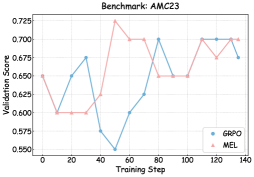
This image presents a line chart illustrating the validation score of two models, GRPO and MEL, as a function of the training step. The chart appears to track the performance of these models during a training process, likely evaluating their generalization ability on a validation dataset. The benchmark used is "AMC23".
### Components/Axes
* **Title:** Benchmark: AMC23 (positioned at the top-center)
* **X-axis:** Training Step (ranging from approximately 0 to 140, with markers every 20 steps)
* **Y-axis:** Validation Score (ranging from approximately 0.55 to 0.725, with markers every 0.025)
* **Legend:** Located in the bottom-right corner.
* GRPO (represented by a blue line with circular markers)
* MEL (represented by a pink line with triangular markers)
### Detailed Analysis
**GRPO (Blue Line):**
The GRPO line exhibits an oscillating trend. It starts at approximately 0.65, dips to a minimum of around 0.575 at a training step of 40, then rises to a peak of approximately 0.68 at a training step of 20. It continues to fluctuate, reaching a plateau around 0.70 between training steps 100 and 140.
* Step 0: ~0.65
* Step 20: ~0.675
* Step 40: ~0.575
* Step 60: ~0.62
* Step 80: ~0.70
* Step 100: ~0.65
* Step 120: ~0.70
* Step 140: ~0.69
**MEL (Pink Line):**
The MEL line also shows fluctuations, but with a different pattern. It begins at approximately 0.62, rises sharply to a maximum of around 0.725 at a training step of 40, then declines to approximately 0.65 at a training step of 100. It then increases again to around 0.68 at a training step of 140.
* Step 0: ~0.62
* Step 20: ~0.625
* Step 40: ~0.725
* Step 60: ~0.70
* Step 80: ~0.70
* Step 100: ~0.65
* Step 120: ~0.67
* Step 140: ~0.68
### Key Observations
* MEL achieves a higher validation score than GRPO initially, peaking at approximately 0.725 compared to GRPO's peak of around 0.70.
* GRPO demonstrates more stable performance in the later stages of training (between steps 100 and 140), with less fluctuation.
* Both models exhibit significant fluctuations in validation score throughout the training process, suggesting sensitivity to the training data or learning rate.
* The initial dip in GRPO's performance around step 40 is a notable anomaly.
### Interpretation
The chart suggests that both GRPO and MEL models are learning and adapting during the training process, as evidenced by the changing validation scores. However, the fluctuations indicate that the training process is not entirely smooth and may be susceptible to overfitting or instability. The higher initial performance of MEL suggests it may be learning faster or more effectively at the beginning of training. The stabilization of GRPO towards the end of training could indicate that it has converged to a more stable solution, while MEL continues to fluctuate. The benchmark "AMC23" likely represents a specific dataset or task used to evaluate the models, and the validation score is a measure of how well the models generalize to unseen data from that benchmark. Further analysis would be needed to determine the root causes of the fluctuations and to optimize the training process for better performance and stability.