\n
## Diagram: Lemma Graph (Main Theorem Related in Red)
### Overview
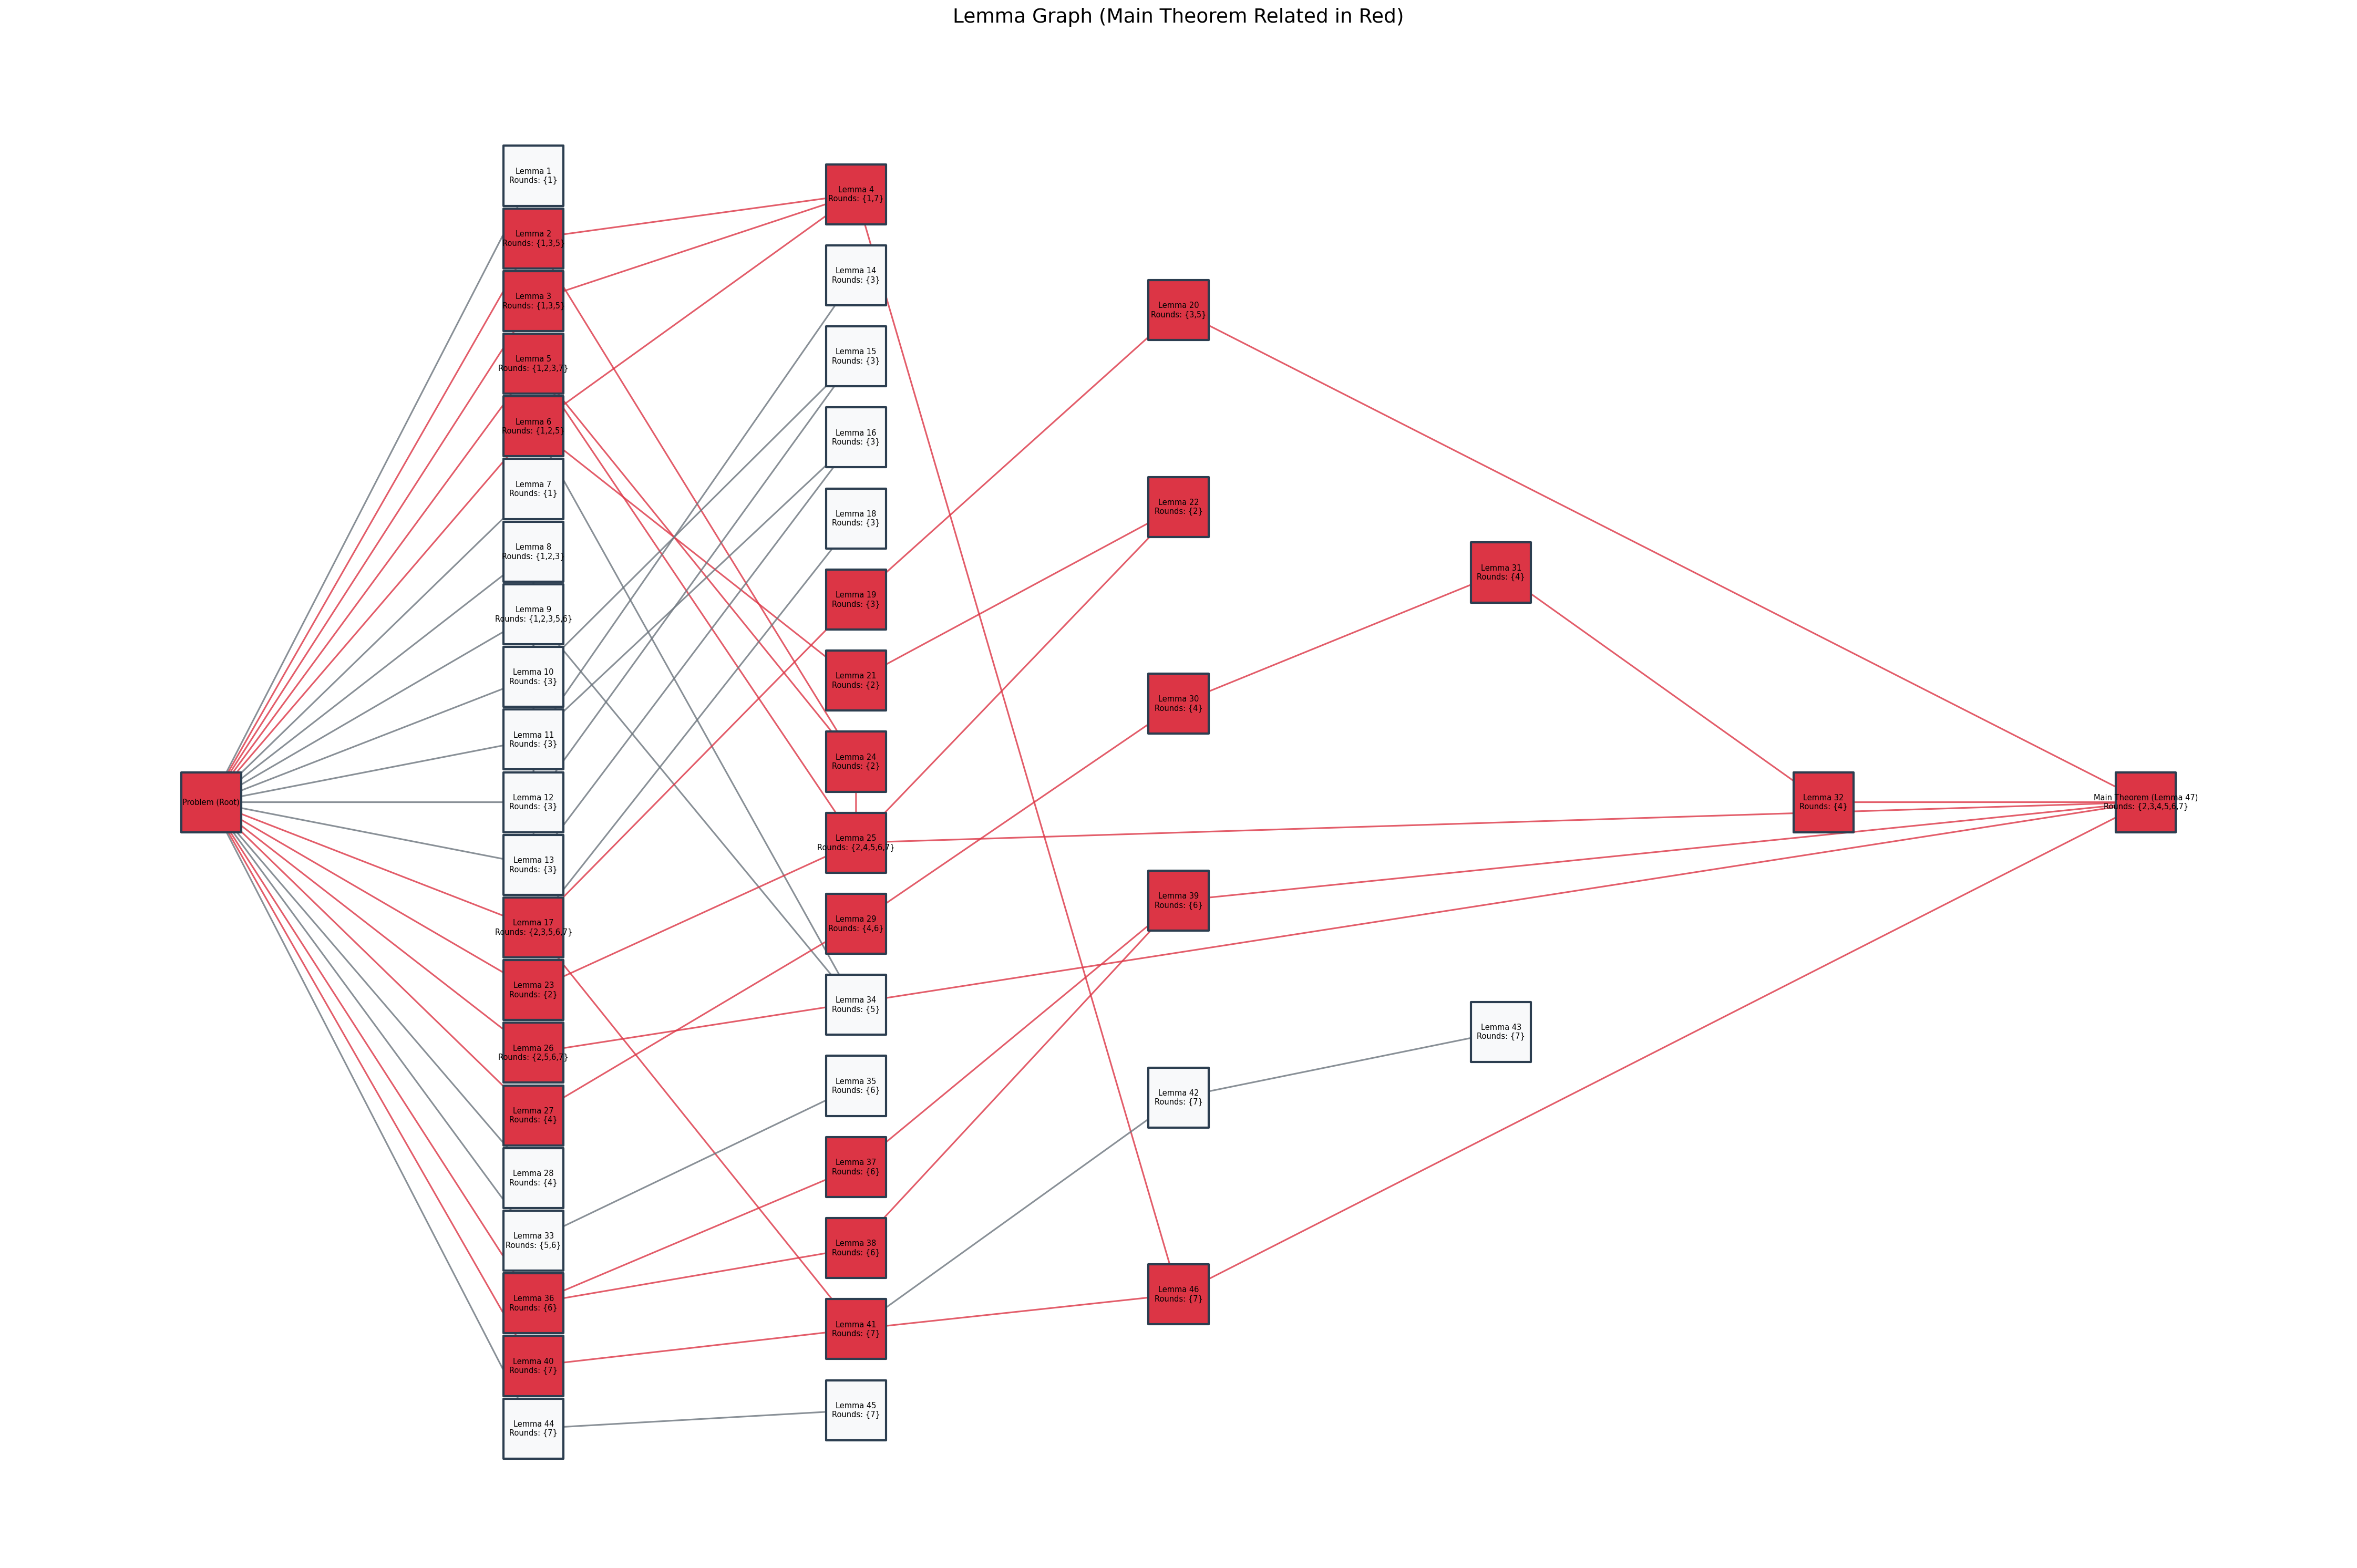
The image presents a diagram representing a lemma graph, likely related to a mathematical theorem. The graph consists of rectangular nodes connected by lines, indicating relationships between lemmas. The main theorem is visually highlighted in red. The diagram appears to illustrate dependencies and connections between various lemmas contributing to the proof of the main theorem.
### Components/Axes
The diagram consists of:
* **Nodes:** Rectangular boxes labeled "Lemma [Number]" and "Results [Number]".
* **Connections:** Lines connecting the nodes, representing dependencies or relationships.
* **Color Coding:** Red color is used to highlight the main theorem.
* **Title:** "Lemma Graph (Main Theorem Related in Red)" positioned at the top-center.
* **Central Node:** A node labeled "Results (1.2.4.1)" is positioned near the center of the diagram.
* **Starting Node:** A node labeled "Problem" is positioned on the left side of the diagram.
* **Ending Nodes:** Several nodes labeled "Lemma [Number]" are positioned on the right side of the diagram.
### Detailed Analysis or Content Details
The diagram contains a large number of lemmas and results. Here's a breakdown of the visible nodes and their connections:
* **Problem Node (Left):** This is the starting point of the graph.
* **Central Results Node:** "Results (1.2.4.1)" is heavily connected to many lemmas.
* **Main Theorem (Right):** Highlighted in red, it appears to be a final result derived from the lemmas.
* **Lemma Nodes (Left):** A cluster of lemmas connected to the "Problem" node. These include:
* Lemma 1 (Results: 1)
* Lemma 2 (Results: 1)
* Lemma 3 (Results: 1)
* Lemma 4 (Results: 1)
* Lemma 5 (Results: 1)
* Lemma 6 (Results: 1)
* Lemma 7 (Results: 1)
* Lemma 8 (Results: 1)
* Lemma 9 (Results: 1)
* Lemma 10 (Results: 1)
* **Lemma Nodes (Center-Left):** Another cluster of lemmas connected to the central "Results (1.2.4.1)" node. These include:
* Lemma 11 (Results: 1)
* Lemma 12 (Results: 1)
* Lemma 13 (Results: 1)
* Lemma 14 (Results: 1)
* Lemma 15 (Results: 1)
* Lemma 16 (Results: 1)
* Lemma 17 (Results: 1)
* Lemma 18 (Results: 1)
* **Lemma Nodes (Center-Right):** A cluster of lemmas connected to the central "Results (1.2.4.1)" node. These include:
* Lemma 19 (Results: 1)
* Lemma 20 (Results: 1)
* Lemma 21 (Results: 1)
* Lemma 22 (Results: 1)
* Lemma 23 (Results: 1)
* Lemma 24 (Results: 1)
* **Lemma Nodes (Right):** A cluster of lemmas connected to the main theorem. These include:
* Lemma 25 (Results: 1)
* Lemma 26 (Results: 1)
* Lemma 27 (Results: 1)
* Lemma 28 (Results: 1)
* Lemma 29 (Results: 1)
The connections are mostly one-way, indicating a direction of dependency. The "Problem" node has many outgoing connections, while the main theorem has several incoming connections. The central "Results (1.2.4.1)" node acts as a hub, connecting many lemmas.
### Key Observations
* The diagram is highly interconnected, suggesting a complex relationship between the lemmas.
* The central "Results (1.2.4.1)" node is a critical component, linking many lemmas together.
* The main theorem is dependent on a large number of lemmas.
* The diagram does not provide any quantitative data, only qualitative relationships.
* The "Results [Number]" notation suggests that each lemma leads to a specific result.
### Interpretation
The diagram visually represents the logical structure of a mathematical proof. The "Problem" node represents the initial statement or question, and the main theorem represents the final conclusion. The lemmas are intermediate steps in the proof, and the lines indicate the dependencies between them. The diagram suggests that the proof is built upon a foundation of interconnected lemmas, with the central "Results (1.2.4.1)" node playing a crucial role in connecting these lemmas to the final theorem. The red highlighting of the main theorem emphasizes its importance as the ultimate goal of the proof. The diagram is a high-level overview of the proof structure and does not provide details about the specific content of each lemma. It is a visual aid for understanding the overall flow of the proof and the relationships between its components. The diagram is a form of knowledge representation, showing how different pieces of mathematical knowledge are connected to achieve a specific result.