# Technical Diagram Analysis
## Diagram Overview
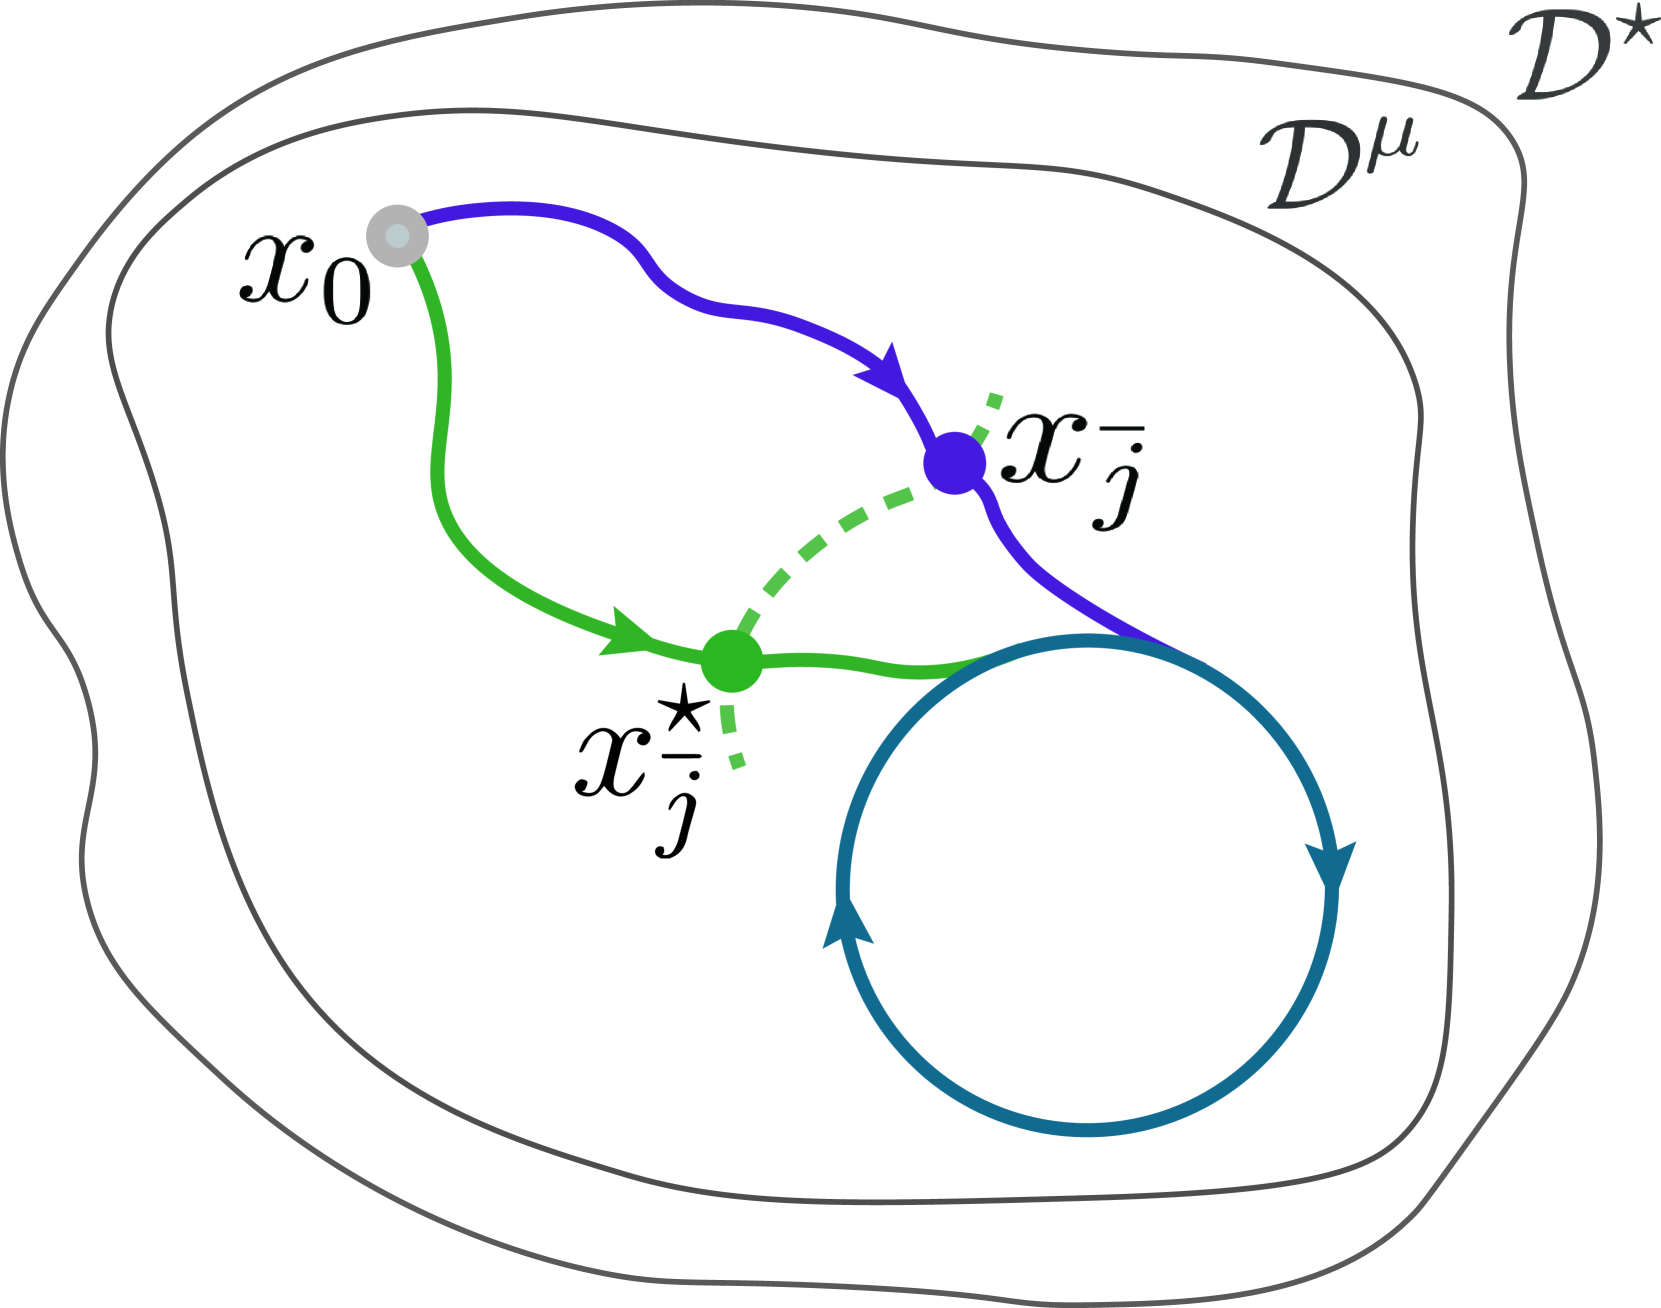
The image depicts a multi-region flow diagram with labeled points and directional arrows. The diagram uses color-coded elements to represent different components and relationships.
## Key Components
### 1. Boundary Regions
- **Outer Boundary**: Labeled `D^μ` (black outline)
- **Inner Boundary**: Labeled `D^⋆` (black outline)
- **Central Region**: Labeled `D` (dark blue circular area)
### 2. Labeled Points
- **x₀**:
- Position: Top-left quadrant
- Color: Gray
- Symbol: Solid circle
- **x_j**:
- Position: Right-center
- Color: Blue
- Symbol: Solid circle
- **x̄_j**:
- Position: Bottom-center
- Color: Green
- Symbol: Solid circle
- **x⋆_j**:
- Position: Bottom-right quadrant
- Color: Dark blue
- Symbol: Solid circle
### 3. Arrows and Connections
- **Primary Flow**:
- Gray arrow: `x₀` → `x_j`
- Green arrow: `x_j` → `x̄_j`
- Dashed green arrow: `x⋆_j` → `x_j`
- **Cyclic Loop**:
- Dark blue circular arrow: Encircles `x⋆_j`
### 4. Legend
- **Color Coding**:
- Gray: `x₀`
- Blue: `x_j`
- Green: `x̄_j`
- Dark Blue: `x⋆_j`
- **Legend Position**: Bottom-right quadrant
## Spatial Relationships
1. `x₀` (gray) is positioned in the upper-left quadrant of `D^μ`.
2. `x_j` (blue) lies in the right-center of `D^⋆`.
3. `x̄_j` (green) is located in the bottom-center of `D^⋆`.
4. `x⋆_j` (dark blue) resides in the bottom-right quadrant of `D^⋆`.
5. The dark blue cyclic loop encloses `x⋆_j` within `D`.
## Flow Dynamics
- **Sequential Path**: `x₀` → `x_j` → `x̄_j` → `x⋆_j` (via dashed green arrow)
- **Feedback Loop**: `x⋆_j` connects back to `x_j` via dashed green arrow
- **Cyclic Behavior**: Dark blue loop indicates persistent activity around `x⋆_j`
## Structural Notes
- All elements are contained within the `D^μ` boundary.
- `D^⋆` serves as an intermediate region between `D^μ` and the central `D`.
- The diagram uses both solid and dashed arrows to distinguish primary flows from secondary connections.
## Validation Checks
1. **Legend Accuracy**: All point colors match their corresponding legend entries.
2. **Spatial Consistency**: Points are positioned within their designated regions.
3. **Flow Logic**: Arrows maintain logical progression between labeled points.
This diagram appears to represent a dynamical system with feedback loops and hierarchical boundary regions, possibly modeling a physical or mathematical process.