\n
## Multi-Panel Line Chart: Attention Weight Analysis for Gemma3-4b-it Layer 1 Heads
### Overview
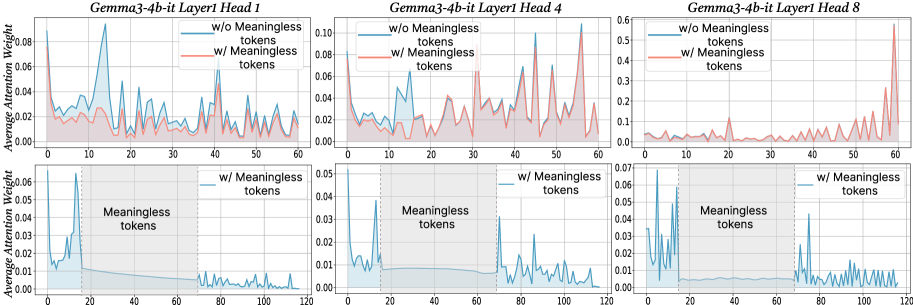
The image displays a 2x3 grid of six line charts analyzing the "Average Attention Weight" across token positions for three different attention heads (Head 1, Head 4, Head 8) in Layer 1 of the "Gemma3-4b-it" model. The charts compare two conditions: with and without "Meaningless tokens." The top row shows a token position range of 0-60, while the bottom row extends the range to 0-120 and includes a shaded region explicitly marking the "Meaningless tokens."
### Components/Axes
* **Chart Type:** Multi-panel line chart with filled areas under the lines.
* **Titles:** Each of the six subplots has a title indicating the model layer and head:
* Top Row (Left to Right): "Gemma3-4b-it Layer1 Head 1", "Gemma3-4b-it Layer1 Head 4", "Gemma3-4b-it Layer1 Head 8"
* Bottom Row (Left to Right): Same titles as above, corresponding to the heads in the top row.
* **Y-Axis:** Labeled "Average Attention Weight" for all charts. The scale varies per subplot:
* Top Row: Head 1 (0.00-0.08), Head 4 (0.00-0.10), Head 8 (0.0-0.6)
* Bottom Row: Head 1 (0.00-0.06), Head 4 (0.00-0.05), Head 8 (0.00-0.07)
* **X-Axis:** Represents token position index. The scale differs between rows:
* Top Row: 0 to 60, with major ticks every 10 units.
* Bottom Row: 0 to 120, with major ticks every 20 units.
* **Legend:** Present in the top-right corner of each subplot in the top row and each subplot in the bottom row.
* **Blue Line/Area:** "w/o Meaningless tokens" (without)
* **Red Line/Area:** "w/ Meaningless tokens" (with)
* **Special Annotation (Bottom Row):** A gray shaded region spanning from x=0 to approximately x=20 in each bottom chart is labeled "Meaningless tokens" in black text.
### Detailed Analysis
**Top Row (Token Positions 0-60):**
* **Head 1:** The blue line ("w/o") shows a very sharp, prominent peak reaching ~0.08 around position 15. The red line ("w/") is generally lower and more stable, with smaller peaks, never exceeding ~0.04.
* **Head 4:** Both lines show significant volatility. The red line ("w/") exhibits several sharp peaks, with the highest reaching ~0.10 near position 55. The blue line ("w/o") has a major peak around position 45 (~0.08).
* **Head 8:** The y-axis scale is much larger (0.6 max). The red line ("w/") dominates, showing a dramatic, exponential-like increase starting around position 40 and peaking at ~0.55 near position 60. The blue line ("w/o") remains very low (<0.1) throughout.
**Bottom Row (Token Positions 0-120, with "Meaningless tokens" region):**
* **Head 1:** Within the shaded "Meaningless tokens" region (0-20), the blue line ("w/o") shows high attention, peaking at ~0.06. After position 20, the blue line drops to a very low baseline (<0.01). The red line ("w/") is not plotted in this chart.
* **Head 4:** Similar pattern. The blue line ("w/o") has high, volatile attention within the meaningless token region (0-20), peaking at ~0.05. After position 20, it drops to a low baseline with minor fluctuations. The red line ("w/") is not plotted.
* **Head 8:** The blue line ("w/o") shows high attention in the meaningless token region (0-20), with multiple peaks up to ~0.07. After position 20, it drops to a low baseline but shows a notable, isolated spike to ~0.04 around position 70. The red line ("w/") is not plotted.
### Key Observations
1. **Divergent Behavior by Head:** The three heads exhibit fundamentally different attention patterns. Head 8 (top row) shows an extreme, late-sequence focus when meaningless tokens are present, while Head 1 shows an early, sharp focus when they are absent.
2. **Impact of "Meaningless Tokens":** The bottom row charts suggest that when the sequence contains a block of "Meaningless tokens" at the beginning (positions 0-20), the model's attention (blue line, "w/o" condition) is heavily concentrated on that block. After the block ends, attention to subsequent tokens drops dramatically.
3. **Scale Discrepancy:** The attention weight magnitudes vary greatly between heads. Head 8 operates on a scale an order of magnitude larger than Head 1 or 4 in the top row comparison.
4. **Volatility:** Head 4 displays the most volatile attention patterns in both conditions in the top row.
### Interpretation
This visualization investigates how the presence of semantically "meaningless" tokens (e.g., padding, special control tokens, or filler text) affects the internal attention mechanisms of a large language model (Gemma3-4b-it).
The data suggests that meaningless tokens act as a strong **attention sink**. In the bottom charts, the model's attention is disproportionately drawn to this initial block, potentially at the expense of attending to later, meaningful content. This is evidenced by the sharp drop in attention weight after the meaningless token region ends.
The comparison in the top row (which likely shows a sequence without a dedicated meaningless block) reveals that different attention heads specialize in different patterns. Head 8, in particular, may be responsible for capturing long-range dependencies or sequence-end phenomena, as its attention skyrockets at the end of the 60-token window when meaningless tokens are part of the context ("w/").
**Practical Implication:** This analysis is crucial for model efficiency and performance. If meaningless tokens consume a large portion of the attention budget, it could degrade the model's ability to process the actual meaningful context. Techniques like "attention sink" removal or token pruning might be informed by such visualizations to improve inference speed and focus. The stark differences between heads also highlight the specialized, non-uniform nature of attention in transformer models.