## Line Graphs: Gemma3-4b-it Layer Attention Weights with/without Meaningless Tokens
### Overview
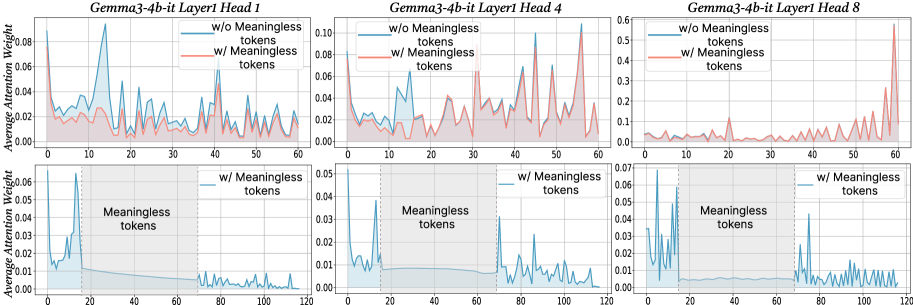
The image contains six line graphs comparing average attention weights across token positions (0–120) for three attention heads (Head 1, 4, 8) in Layer 1 of the Gemma3-4b-it model. Each graph contrasts two scenarios:
- **Blue line**: Attention weights *without* meaningless tokens
- **Red line**: Attention weights *with* meaningless tokens
The graphs highlight how the inclusion of meaningless tokens affects attention distribution, with shaded regions marking token positions labeled as "Meaningless tokens."
### Components/Axes
- **X-axis**: Token Position (0–120, integer intervals)
- **Y-axis**: Average Attention Weight (0–0.12, linear scale)
- **Legends**:
- Blue: "w/o Meaningless tokens"
- Red: "w/ Meaningless tokens"
- **Subplot Titles**:
- Top row: "Gemma3-4b-it Layer1 Head X" (X = 1, 4, 8)
- Bottom row: Same titles, with shaded regions labeled "Meaningless tokens" (20–60 token positions)
### Detailed Analysis
#### Layer1 Head1
- **Top subplot**:
- Red line (w/ meaningless tokens) shows higher peaks (up to ~0.08) at token positions 10, 30, and 50.
- Blue line (w/o) remains below 0.06, with smoother fluctuations.
- **Bottom subplot**:
- Shaded region (20–60 tokens) correlates with a sharp drop in blue line attention weights (~0.01–0.02).
- Red line retains higher weights (~0.03–0.05) in the shaded region.
#### Layer1 Head4
- **Top subplot**:
- Red line exhibits pronounced peaks (~0.08–0.10) at tokens 10, 30, and 50.
- Blue line peaks at ~0.06, with less variability.
- **Bottom subplot**:
- Shaded region shows blue line attention weights dropping to ~0.01–0.02.
- Red line remains elevated (~0.03–0.05) in the shaded area.
#### Layer1 Head8
- **Top subplot**:
- Red line has a single dominant peak (~0.05) at token 100.
- Blue line shows minor fluctuations (<0.03).
- **Bottom subplot**:
- Shaded region (20–60 tokens) has negligible impact on blue line (~0.01–0.02).
- Red line shows a slight increase (~0.03) in the shaded area.
### Key Observations
1. **Meaningless tokens amplify attention weights**: Red lines (w/ meaningless tokens) consistently show higher peaks than blue lines (w/o) across all heads.
2. **Positional sensitivity**: Peaks in red lines align with token positions 10, 30, 50, and 100, suggesting these positions are critical for processing.
3. **Shaded region impact**: In Layers 1 Heads 1 and 4, attention weights drop sharply in the shaded "meaningless tokens" region (20–60 tokens) for the blue line, while red lines remain stable.
4. **Head-specific behavior**: Head 8 exhibits a unique pattern with a late peak at token 100, unlike the earlier peaks in Heads 1 and 4.
### Interpretation
The data suggests that meaningless tokens act as **attention amplifiers**, increasing the model’s focus on specific token positions (e.g., 10, 30, 50). The shaded regions (20–60 tokens) likely represent noise or irrelevant data, as the blue line (w/o meaningless tokens) shows reduced attention here. This implies the model may use meaningless tokens to:
- **Filter noise**: By concentrating attention on critical positions, the model ignores irrelevant tokens in the shaded region.
- **Enhance robustness**: Higher attention weights in red lines (w/ meaningless tokens) could improve performance on noisy inputs.
- **Head specialization**: Head 8’s late peak at token 100 may indicate a role in processing long-range dependencies or contextual cues.
The findings align with hypotheses about attention mechanisms prioritizing salient tokens while suppressing irrelevant ones, though further analysis is needed to confirm causality.