## Line Chart: Reward/Margin vs. Factuality Margin Penalty
### Overview
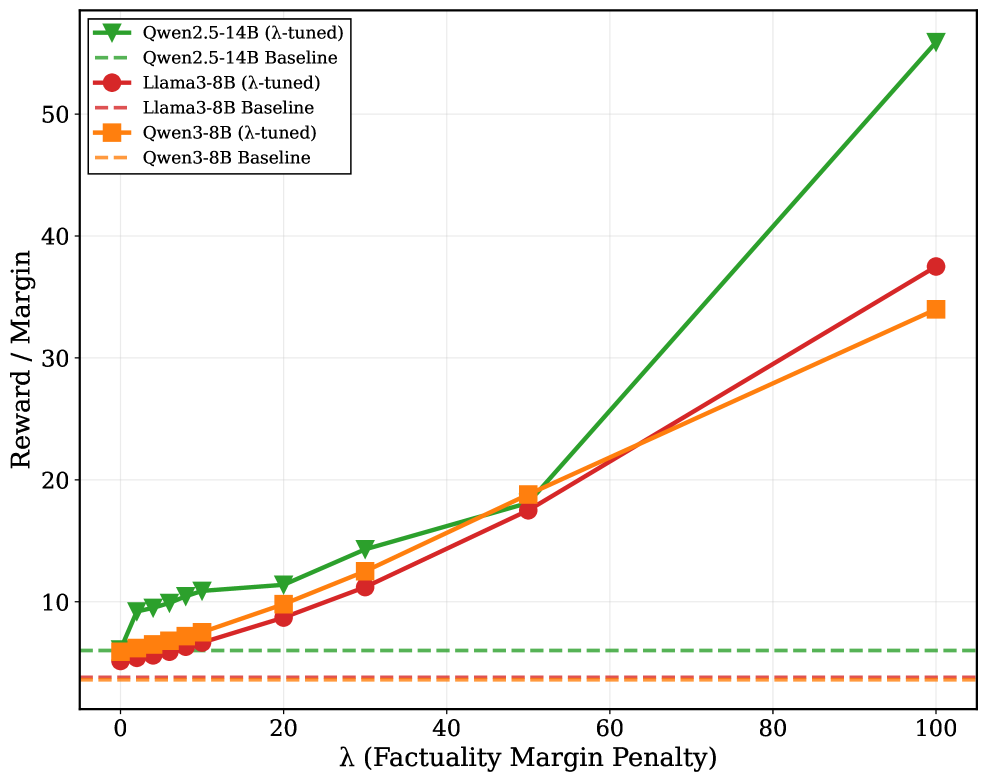
The image is a line chart comparing the performance of different language models (Qwen2.5-14B, Llama3-8B, and Qwen3-8B) under varying levels of factuality margin penalty (lambda). The chart plots "Reward / Margin" on the y-axis against "λ (Factuality Margin Penalty)" on the x-axis. Each model has two lines: one representing the "λ-tuned" version and the other representing the "Baseline" version.
### Components/Axes
* **X-axis:** λ (Factuality Margin Penalty). Scale ranges from 0 to 100, with tick marks at 0, 20, 40, 60, 80, and 100.
* **Y-axis:** Reward / Margin. Scale ranges from 0 to 50, with tick marks at 10, 20, 30, 40, and 50.
* **Legend:** Located in the top-left corner.
* Green triangle marker with solid line: Qwen2.5-14B (λ-tuned)
* Green dashed line: Qwen2.5-14B Baseline
* Red circle marker with solid line: Llama3-8B (λ-tuned)
* Red dashed line: Llama3-8B Baseline
* Orange square marker with solid line: Qwen3-8B (λ-tuned)
* Orange dashed line: Qwen3-8B Baseline
### Detailed Analysis
**1. Qwen2.5-14B (λ-tuned) - Green solid line with triangle markers:**
* Trend: Shows a generally increasing trend.
* Data Points:
* λ = 0, Reward/Margin ≈ 9
* λ = 10, Reward/Margin ≈ 10
* λ = 20, Reward/Margin ≈ 12
* λ = 30, Reward/Margin ≈ 14
* λ = 50, Reward/Margin ≈ 18
* λ = 100, Reward/Margin ≈ 54
**2. Qwen2.5-14B Baseline - Green dashed line:**
* Trend: Constant.
* Value: Reward/Margin ≈ 6
**3. Llama3-8B (λ-tuned) - Red solid line with circle markers:**
* Trend: Shows an increasing trend.
* Data Points:
* λ = 0, Reward/Margin ≈ 5
* λ = 20, Reward/Margin ≈ 9
* λ = 50, Reward/Margin ≈ 18
* λ = 100, Reward/Margin ≈ 38
**4. Llama3-8B Baseline - Red dashed line:**
* Trend: Constant.
* Value: Reward/Margin ≈ 4
**5. Qwen3-8B (λ-tuned) - Orange solid line with square markers:**
* Trend: Shows an increasing trend.
* Data Points:
* λ = 0, Reward/Margin ≈ 6
* λ = 20, Reward/Margin ≈ 9
* λ = 50, Reward/Margin ≈ 18
* λ = 100, Reward/Margin ≈ 34
**6. Qwen3-8B Baseline - Orange dashed line:**
* Trend: Constant.
* Value: Reward/Margin ≈ 3
### Key Observations
* The "λ-tuned" versions of all models show an increase in "Reward / Margin" as the "Factuality Margin Penalty" (λ) increases.
* The "Baseline" versions of all models show a constant "Reward / Margin" regardless of the "Factuality Margin Penalty" (λ).
* Qwen2.5-14B (λ-tuned) achieves the highest "Reward / Margin" at λ = 100.
* The baseline models have significantly lower reward/margin scores than their lambda-tuned counterparts.
### Interpretation
The chart suggests that applying a factuality margin penalty (λ) and tuning the models accordingly can significantly improve the "Reward / Margin" metric. The Qwen2.5-14B model appears to benefit the most from this tuning, achieving the highest "Reward / Margin" among the models tested. The baseline models, which are not tuned with the factuality margin penalty, show a consistently low "Reward / Margin," indicating that the penalty and tuning process is crucial for improving performance. The similar trends of Llama3-8B and Qwen3-8B suggest that they respond similarly to the factuality margin penalty.