# Technical Document Extraction: Reward / Margin vs. Factuality Margin Penalty
## 1. Component Isolation
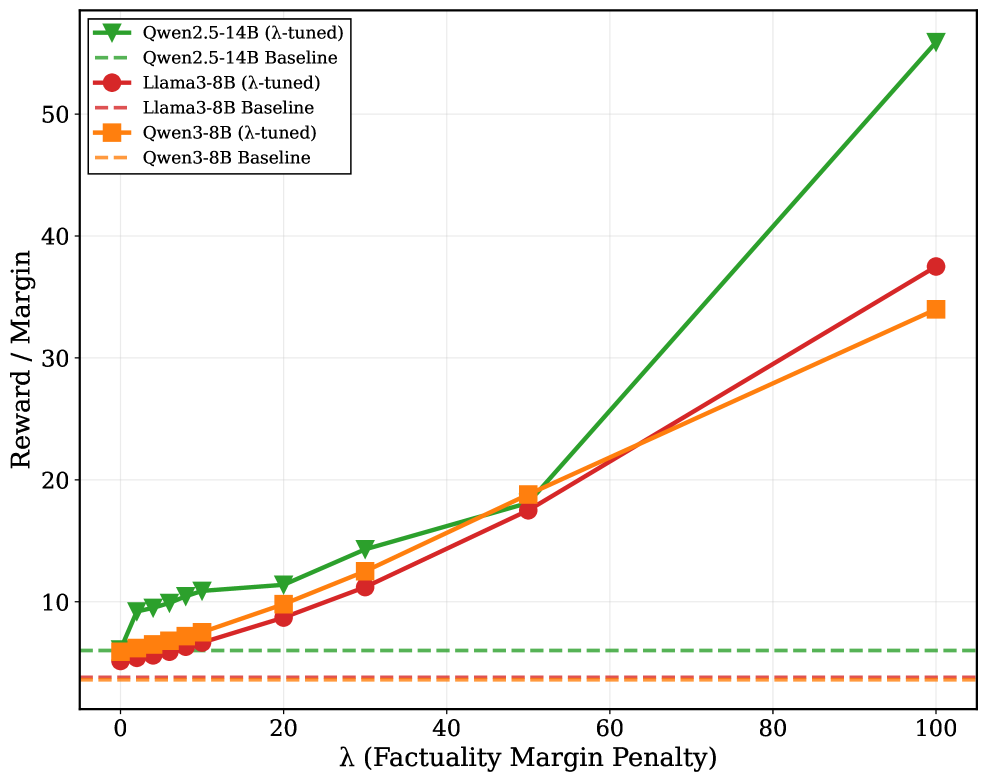
* **Header/Legend:** Located in the top-left quadrant. Contains six entries identifying three model families, each with a "$\lambda$-tuned" variant and a "Baseline" variant.
* **Main Chart Area:** A line graph plotted on a Cartesian coordinate system with a light gray grid.
* **Axes:**
* **Y-Axis (Vertical):** Labeled "Reward / Margin". Scales from 10 to 50 with major tick marks every 10 units.
* **X-Axis (Horizontal):** Labeled "$\lambda$ (Factuality Margin Penalty)". Scales from 0 to 100 with major tick marks every 20 units.
---
## 2. Legend and Data Series Identification
The legend is located at approximately `[x=0.05, y=0.95]` (normalized coordinates from top-left).
| Color | Marker / Line Style | Label |
| :--- | :--- | :--- |
| **Green** | Solid line with Downward Triangle ($\nabla$) | Qwen2.5-14B ($\lambda$-tuned) |
| **Green** | Dashed line (no marker) | Qwen2.5-14B Baseline |
| **Red** | Solid line with Circle ($\bullet$) | Llama3-8B ($\lambda$-tuned) |
| **Red** | Dashed line (no marker) | Llama3-8B Baseline |
| **Orange** | Solid line with Square ($\blacksquare$) | Qwen3-8B ($\lambda$-tuned) |
| **Orange** | Dashed line (no marker) | Qwen3-8B Baseline |
---
## 3. Trend Verification and Data Extraction
### A. Baseline Series (Horizontal Reference Lines)
All baseline models are represented by horizontal dashed lines, indicating their performance is constant regardless of the $\lambda$ value.
* **Qwen2.5-14B Baseline (Green Dashed):** Constant at approximately **y = 6.0**.
* **Llama3-8B Baseline (Red Dashed):** Constant at approximately **y = 3.8**.
* **Qwen3-8B Baseline (Orange Dashed):** Constant at approximately **y = 3.8** (overlapping with Llama3-8B).
### B. $\lambda$-tuned Series (Dynamic Lines)
All tuned models show a positive correlation between the Factuality Margin Penalty ($\lambda$) and the Reward/Margin.
#### 1. Qwen2.5-14B ($\lambda$-tuned) [Green Solid Line]
* **Trend:** Slopes upward moderately from $\lambda=0$ to $\lambda=30$, then exhibits a sharp, steep increase (super-linear growth) between $\lambda=50$ and $\lambda=100$.
* **Key Data Points (Approximate):**
* $\lambda=0$: ~6.0
* $\lambda=10$: ~11.0
* $\lambda=30$: ~14.5
* $\lambda=50$: ~18.0
* $\lambda=100$: **~56.0** (The highest value on the chart).
#### 2. Llama3-8B ($\lambda$-tuned) [Red Solid Line]
* **Trend:** Slopes upward steadily and almost linearly throughout the entire range. It remains the lowest-performing tuned model until $\lambda=100$, where it overtakes the Qwen3-8B tuned model.
* **Key Data Points (Approximate):**
* $\lambda=0$: ~5.0
* $\lambda=20$: ~9.0
* $\lambda=50$: ~17.5
* $\lambda=100$: **~37.5**.
#### 3. Qwen3-8B ($\lambda$-tuned) [Orange Solid Line]
* **Trend:** Slopes upward steadily. It maintains a higher reward than the Llama3-8B tuned model for most of the range ($\lambda=0$ to $\lambda=60$) but is eventually surpassed by Llama3-8B as $\lambda$ approaches 100.
* **Key Data Points (Approximate):**
* $\lambda=0$: ~5.5
* $\lambda=20$: ~10.0
* $\lambda=50$: ~19.0
* $\lambda=100$: **~34.0**.
---
## 4. Summary of Findings
* **Impact of Tuning:** For all models, applying the $\lambda$ penalty significantly increases the "Reward / Margin" compared to their respective baselines.
* **Model Comparison:** The **Qwen2.5-14B** model is the most sensitive to the Factuality Margin Penalty, showing a massive performance spike as $\lambda$ exceeds 50.
* **Scaling Behavior:** While Llama3-8B and Qwen3-8B show relatively linear growth, Qwen2.5-14B shows exponential-like growth at higher penalty values.
* **Baseline Parity:** The Llama3-8B and Qwen3-8B models share nearly identical baseline performance levels, while the Qwen2.5-14B baseline starts at a higher reward level.